Cultural diversity has become a critical success factor for modern organizations. Diverse teams bring better ideas, stronger collaboration, and improved business performance. However, organizations cannot improve diversity unless they measure it clearly and consistently. When diversity data remains scattered across HR systems or static reports, decision-making becomes slow and ineffective.Cultural Diversity KPI Dashboard in Google Sheets
That is exactly why a Cultural Diversity KPI Dashboard in Google Sheets becomes essential.
This ready-to-use dashboard helps organizations track, monitor, and analyze cultural diversity metrics using structured KPIs, targets, trends, and year-over-year comparisons. Because it is built in Google Sheets, it remains flexible, collaborative, and cost-effective.
In this article, we explain how the dashboard works, its worksheet structure, a complete list of cultural diversity KPIs with formulas, and best practices for diversity tracking.Cultural Diversity KPI Dashboard in Google Sheets
What Is a Cultural Diversity KPI Dashboard in Google Sheets?
Click to Buy Cultural Diversity KPI Dashboard in Google Sheets
A Cultural Diversity KPI Dashboard is a performance tracking tool designed to measure workforce diversity across gender, ethnicity, nationality, age, and inclusion indicators. It provides leadership with clear visibility into representation, equity, and inclusion performance.
Because this dashboard uses Google Sheets, it offers:
-
Centralized diversity reporting
-
Easy collaboration for HR and DEI teams
-
Real-time KPI updates
-
Transparent formulas and definitions
-
No dependency on expensive BI tools
This dashboard supports HR teams, DEI leaders, compliance teams, and senior management.
Key Features of the Cultural Diversity KPI Dashboard
The dashboard includes 6 structured worksheet tabs, each designed to support accurate diversity tracking and analysis.
Dashboard Sheet Tab (Main Dashboard)
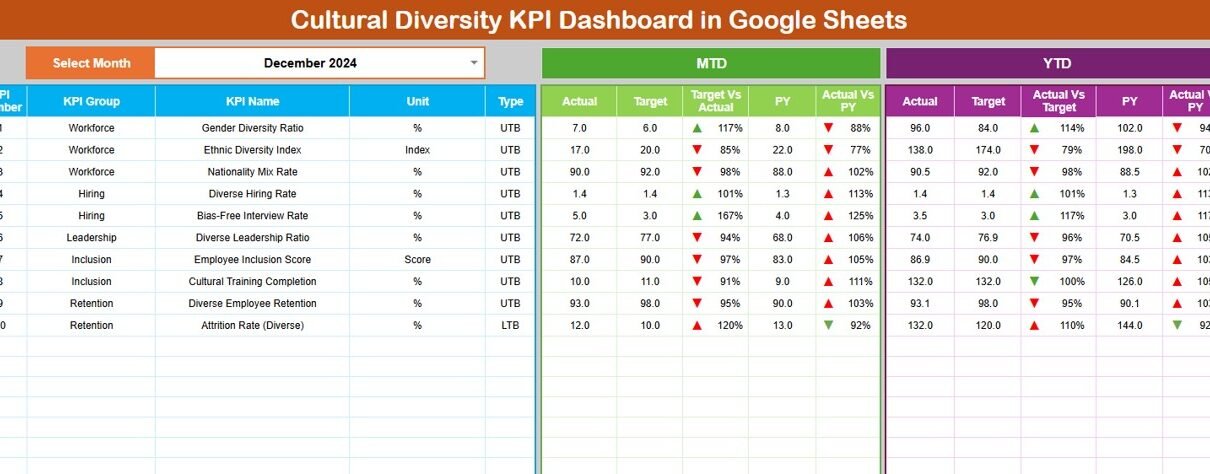
The Dashboard Sheet provides a consolidated view of all cultural diversity KPIs.
-
Select the month from the dropdown in cell D3
-
All KPI values update automatically for the selected month
Metrics Displayed
MTD (Month-to-Date)
-
Actual
-
Target
-
Previous Year
-
Target vs Actual
-
Previous Year vs Actual
YTD (Year-to-Date)
-
Actual
-
Target
-
Previous Year
-
Target vs Actual
-
Previous Year vs Actual
Conditional formatting with up and down arrows highlights improvement or decline instantly.

Click to Buy Cultural Diversity KPI Dashboard in Google Sheets
KPI Trend Sheet Tab
The KPI Trend Sheet enables detailed analysis of individual diversity KPIs.
-
Select the KPI name from the dropdown in cell C3
The sheet displays:
-
KPI Group
-
Unit of Measurement
-
KPI Type (Upper the Better / Lower the Better)
-
KPI Formula
-
KPI Definition
It also shows KPI trends across months, helping teams track progress over time.

Click to Buy Cultural Diversity KPI Dashboard in Google Sheets
Actual Number Sheet Tab
This sheet stores actual diversity performance data.
-
Select the first month of the year in cell E1
-
Enter MTD and YTD actual values for each KPI
All charts and dashboards update automatically.

Target Sheet Tab
The Target Sheet stores diversity goals.
-
Monthly (MTD) targets
-
Annual (YTD) targets
Targets help organizations align diversity efforts with corporate inclusion strategies.

Click to Buy Cultural Diversity KPI Dashboard in Google Sheets
Previous Year Number Sheet Tab
This sheet stores previous year diversity data.
It supports:
-
Year-over-year comparison
-
Benchmarking progress
-
Measuring long-term improvement

Click to Buy Cultural Diversity KPI Dashboard in Google Sheets
KPI Definition Sheet Tab
The KPI Definition Sheet acts as the foundation of the dashboard.
It includes:
-
KPI Name
-
KPI Group
-
Unit
-
Formula
-
KPI Definition
-
KPI Type (UTB / LTB)
This ensures clarity, consistency, and audit readiness.

Click to Buy Cultural Diversity KPI Dashboard in Google Sheets
Advantages of Cultural Diversity KPI Dashboard
-
Centralized diversity tracking
-
Clear target vs actual visibility
-
Improved transparency and accountability
-
Better DEI decision-making
-
Easy reporting for leadership
-
Cost-effective Google Sheets solution
Opportunities for Improvement in Diversity Tracking
-
Add intersectional diversity metrics
-
Track supplier diversity KPIs
-
Integrate anonymous survey tools
-
Automate HR data imports
-
Add diversity risk indicators
-
Align KPIs with global DEI standards
Best Practices for Using the Dashboard
Click to Buy Cultural Diversity KPI Dashboard in Google Sheets
-
Define diversity KPIs clearly
-
Set realistic and ethical targets
-
Update data consistently
-
Review trends quarterly
-
Protect sensitive employee data
-
Communicate results transparently
Conclusion
A Cultural Diversity KPI Dashboard in Google Sheets helps organizations move from intention to action. By tracking representation, inclusion, and equity metrics with MTD, YTD, and year-over-year analysis, organizations gain clarity and confidence in their diversity strategy. Because the dashboard runs in Google Sheets, it remains accessible, flexible, and easy to manage.
For organizations committed to building inclusive workplaces, this dashboard becomes an essential performance management tool.
Frequently Asked Questions (FAQs)
Click to Buy Cultural Diversity KPI Dashboard in Google Sheets
1. Who should use this dashboard?
HR teams, DEI leaders, compliance teams, and executives.
2. Can KPIs be customized?
Yes, all KPIs, formulas, and targets are editable.
3. Does it support confidential data?
Yes, with proper Google Sheets access controls.
4. Can it track multiple locations?
Yes, the structure supports multi-location data.
5. Is it suitable for audits or ESG reporting?
Yes, it supports structured and transparent reporting.
6. Does it require technical skills?
No, basic Google Sheets knowledge is enough.
Visit our YouTube channel to learn step-by-step video tutorials
Youtube.com/@NeotechNavigators
Watch the step-by-step video tutorial:
Click to Buy Cultural Diversity KPI Dashboard in Google Sheets