Customer feedback plays a vital role in business growth. Reviews, ratings, surveys, and comments help organizations understand customer expectations, service gaps, and improvement opportunities. However, when teams track feedback data using scattered files or raw survey results, insights remain unclear and decisions get delayed.Customer Feedback KPI Dashboard in Google Sheets
A Customer Feedback KPI Dashboard in Google Sheets solves this problem by converting raw feedback data into clear, actionable KPIs. It helps teams monitor satisfaction scores, complaint trends, response efficiency, and overall customer experience. Because this dashboard works in Google Sheets, it stays simple, collaborative, and cost-effective.Customer Feedback KPI Dashboard in Google Sheets
What Is a Customer Feedback KPI Dashboard in Google Sheets?
Click to Buy Customer Feedback KPI Dashboard in Google Sheets
A Customer Feedback KPI Dashboard is a centralized reporting tool that tracks customer satisfaction, experience quality, and feedback handling performance. It helps organizations answer questions such as:Customer Feedback KPI Dashboard in Google Sheets
- How satisfied are customers overall?
- Are feedback scores improving or declining?
- How fast does the team respond to feedback?
- Which feedback channels generate more complaints?
- Are negative reviews reducing over time?
Instead of manually analyzing survey results, teams view clear KPIs, trends, and comparisons in one place.
Because the dashboard uses Google Sheets, it offers:
- Real-time updates
- Automated calculations
- MTD and YTD analysis
- Easy collaboration
- No dependency on expensive tools
Key Features of the Customer Feedback KPI Dashboard
This ready-to-use dashboard includes:
Central dashboard with KPI comparisons
Monthly and yearly performance tracking
Trend analysis for each KPI
Target vs actual comparison
Previous year benchmarking
Clear KPI definitions
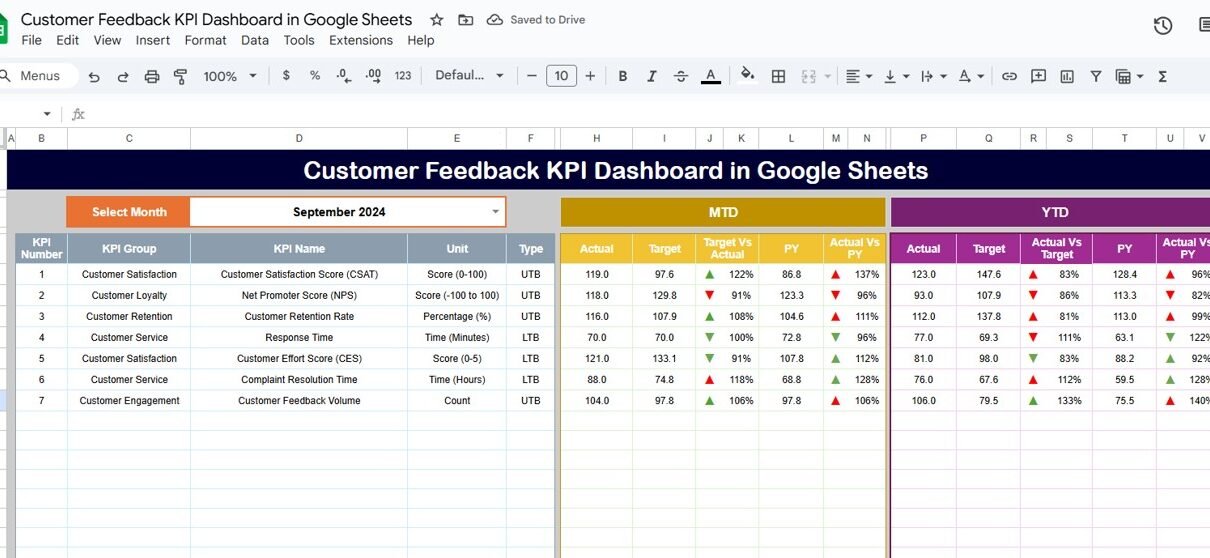
Dashboard Sheet Tab (Main Dashboard)
Click to Buy Customer Feedback KPI Dashboard in Google Sheets
This is the main reporting page.
-
Select the month from the dropdown in cell D3
-
The dashboard updates automatically for the selected month
MTD Section Includes
-
MTD Actual
-
MTD Target
-
MTD Previous Year
-
Target vs Actual
-
Previous Year vs Actual
YTD Section Includes
-
YTD Actual
-
YTD Target
-
YTD Previous Year
-
Target vs Actual
-
Previous Year vs Actual
Conditional formatting with up and down arrows highlights performance improvement or decline clearly.

Click to Buy Customer Feedback KPI Dashboard in Google Sheets
KPI Trend Sheet Tab
This sheet allows deep KPI-level analysis.
-
Select the KPI from the dropdown in cell C3
The sheet displays:
-
KPI Group
-
KPI Unit
-
KPI Type (Lower the Better / Upper the Better)
-
KPI Formula
-
KPI Definition
It also shows a month-wise trend chart, helping teams identify customer experience patterns over time.

Click to Buy Customer Feedback KPI Dashboard in Google Sheets
Actual Number Sheet Tab
This sheet captures real customer feedback data.
-
Enter MTD Actual and YTD Actual values
-
Select the first month of the year in cell E1
Once updated, the dashboard refreshes automatically.

Target Sheet Tab
This sheet stores performance goals.
-
Monthly (MTD) targets
-
Annual (YTD) targets
Targets help teams align customer feedback performance with service objectives.

Click to Buy Customer Feedback KPI Dashboard in Google Sheets
Previous Year Number Sheet Tab
This sheet stores last year’s KPI values.
It helps teams:
-
Compare year-over-year experience trends
-
Measure improvement impact
-
Identify recurring issues

KPI Definition Sheet Tab
This reference sheet ensures clarity and consistency.
It contains:
-
KPI Name
-
KPI Group
-
Unit
-
Formula
-
Definition
-
KPI Type (LTB / UTB)’

Click to Buy Customer Feedback KPI Dashboard in Google Sheets
Advantages of the Customer Feedback KPI Dashboard
- Centralized customer voice tracking
Faster issue identification
Better service quality decisions
Improved customer retention
Department-wide visibility
Easy reporting in Google Sheets
Opportunities for Improvement
Click to Buy Customer Feedback KPI Dashboard in Google Sheets
-
Integrate survey tools automatically
-
Add sentiment analysis scoring
-
Track feedback by product or service
-
Set SLA alerts for delayed responses
-
Add machine learning-based insights
Best Practices for Using the Dashboard
Update feedback data regularly
Review trends instead of single months
Set realistic customer experience targets
Act on negative feedback quickly
Share insights across departments
Maintain KPI definitions clearly
Conclusion
Click to Buy Customer Feedback KPI Dashboard in Google Sheets
A Customer Feedback KPI Dashboard in Google Sheets helps organizations transform customer opinions into measurable insights. It tracks satisfaction, loyalty, complaint handling, and improvement effectiveness through structured KPIs. Because the dashboard is simple, flexible, and collaborative, teams improve customer experience consistently without complexity.
Frequently Asked Questions (FAQs)
1. Who should use this dashboard?
Customer support, CX teams, marketing, and leadership.
2. Can I customize KPIs?
Yes, all KPIs are fully editable.
3. Does the dashboard support MTD and YTD reporting?
Yes, both views are available.
4. Can I automate data import later?
Yes, using Google Forms or Apps Script.
5. Is Google Sheets secure for feedback data?
Yes, with proper access controls.
Watch the step-by-step video tutorial:
Visit our YouTube channel to learn step-by-step video tutorials
Youtube.com/@NeotechNavigators
Click to Buy Customer Feedback KPI Dashboard in Google Sheets