Understanding how much value a customer brings over time is critical for sustainable business growth. However, many organizations still struggle to calculate, track, and analyze Customer Lifetime Value accurately. Data often stays scattered across spreadsheets, CRM systems, and finance tools. As a result, teams make decisions based on assumptions instead of facts.
That is exactly where a Customer Lifetime Value KPI Dashboard in Google Sheets becomes a powerful and practical solution.
This ready-to-use dashboard helps businesses measure customer profitability, retention, acquisition efficiency, and long-term revenue contribution in one centralized view. Moreover, because it runs in Google Sheets, teams can collaborate easily, update data quickly, and analyze performance without expensive BI tools.
What Is a Customer Lifetime Value KPI Dashboard in Google Sheets?
A Customer Lifetime Value (CLV) KPI Dashboard is an analytics tool designed to track how much revenue and profit a customer generates throughout their relationship with a business. Instead of focusing only on short-term sales, this dashboard highlights long-term customer value.
Because the dashboard runs in Google Sheets, it allows teams to:
- Track CLV monthly and yearly
- Compare actual vs target CLV
- Analyze retention and churn impact
- Monitor acquisition cost vs lifetime value
- Identify high-value customer segments
As a result, marketing, sales, finance, and leadership teams gain a shared, data-driven understanding of customer value.
Key Features of the Customer Lifetime Value KPI Dashboard
Click to Buy Customer Lifetime Value KPI Dashboard in Google Sheets
This dashboard is fully structured and includes 6 integrated worksheets, each designed for a specific purpose.
Dashboard Sheet Tab (Main Page)
This is the primary view of the dashboard.
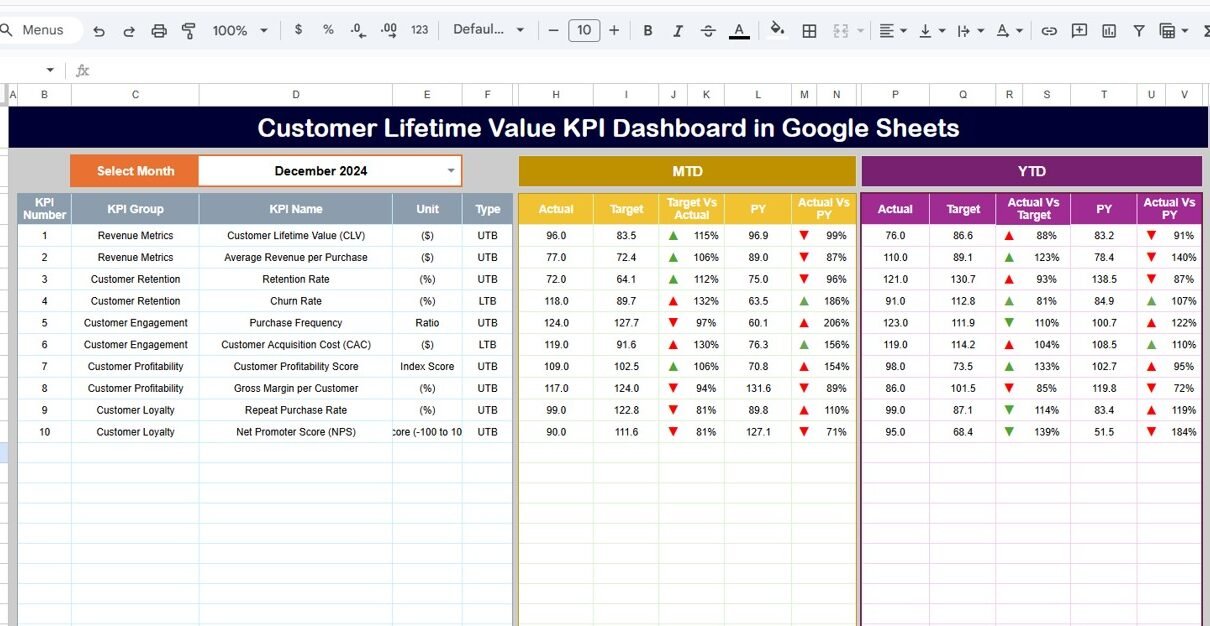
Month Selection
- On cell D3, you select the month from a dropdown.
- Once selected, the entire dashboard updates automatically.
KPIs Displayed
The dashboard shows both MTD and YTD performance:
MTD (Month-to-Date)
- MTD Actual
- MTD Target
- MTD Previous Year
- Target vs Actual
- Previous Year vs Actual
YTD (Year-to-Date)
- YTD Actual
- YTD Target
- YTD Previous Year
- Target vs Actual
- Previous Year vs Actual
Conditional formatting with up and down arrows helps users instantly understand whether CLV performance is improving or declining.

Click to Buy Customer Lifetime Value KPI Dashboard in Google Sheets
KPI Trend Sheet Tab
This sheet focuses on trend analysis for individual KPIs.
How It Works
-
Select a KPI name from the dropdown in cell C3.
The sheet automatically displays:
- KPI Group
- KPI Unit
- KPI Type (Upper the Better / Lower the Better)
- KPI Formula
- KPI Definition
Purpose
This sheet helps teams analyze:
- Long-term CLV behavior
- Monthly fluctuations
- Impact of retention or churn initiatives
- Strategic improvement areas

Click to Buy Customer Lifetime Value KPI Dashboard in Google Sheets
Actual Number Sheet Tab
This is the data entry sheet for actual performance.
Key Features
- Enter MTD and YTD actual values for each KPI.
- Change the starting month of the year using cell E1.
- The dashboard recalculates automatically based on entered data.
This sheet ensures accuracy and consistency in reporting.

Target Sheet Tab
This sheet stores planned targets for each KPI.
Purpose
- Define monthly and yearly CLV goals
- Compare expected vs actual performance
- Support forecasting and budgeting decisions
Targets help teams measure success objectively.

Click to Buy Customer Lifetime Value KPI Dashboard in Google Sheets
Previous Year Number Sheet Tab
This sheet contains last year’s KPI values.
Why It Matters
- Enables YoY comparison
- Shows long-term CLV improvement
- Highlights impact of retention strategies
Year-over-year comparison provides valuable strategic insights.

KPI Definition Sheet Tab
This sheet acts as the KPI reference dictionary.
- KPI Name
- KPI Group
- Unit
- Formula
- KPI Definition
- KPI Type (LTB / UTB)
This ensures clarity, transparency, and consistent interpretation across teams.

Click to Buy Customer Lifetime Value KPI Dashboard in Google Sheets
Advantages of the Customer Lifetime Value KPI Dashboard
- Clear view of long-term customer value
- Better marketing and sales decisions
- Improved retention strategy planning
- Accurate ROI measurement
- Reduced dependency on complex BI tools
- Easy collaboration in Google Sheets
Opportunities for Improvement in CLV Tracking
- Add customer segment-wise CLV analysis
- Integrate CRM or billing system data
- Include predictive CLV forecasting
- Track cohort-based CLV trends
- Automate data updates using APIs
Best Practices for Using the CLV KPI Dashboard
Click to Buy Customer Lifetime Value KPI Dashboard in Google Sheets
- Update data monthly without delays
- Define clear KPI ownership
- Review CLV trends quarterly
- Align CLV targets with business strategy
- Use insights to improve retention programs
Conclusion
A Customer Lifetime Value KPI Dashboard in Google Sheets helps organizations shift focus from short-term sales to long-term customer profitability. With structured KPIs, automated calculations, and dynamic analysis, this dashboard becomes an essential decision-making tool. Because it is easy to use and fully customizable, teams can track CLV accurately and improve customer relationships with confidence.
Frequently Asked Questions (FAQs)
Click to Buy Customer Lifetime Value KPI Dashboard in Google Sheets
1. Who should use a CLV KPI Dashboard?
Marketing, sales, finance, and leadership teams.
2. Is Google Sheets suitable for CLV tracking?
Yes, it offers flexibility, collaboration, and real-time updates.
3. Can I customize KPIs?
Yes, all KPIs can be modified or extended.
4. How often should CLV be reviewed?
Monthly for tracking and quarterly for strategy.
5. Does the dashboard support YoY comparison?
Yes, through the Previous Year sheet.
6. Can this dashboard scale for large datasets?
Yes, with structured data and filters.
Visit our YouTube channel to learn step-by-step video tutorials
Youtube.com/@NeotechNavigators
Watch the step-by-step video tutorial:
Click to Buy Customer Lifetime Value KPI Dashboard in Google Sheets