In the fast-paced world of beverage and alcohol production, data-driven decision-making is key to maintaining efficiency, profitability, and quality. Whether you manage a small craft distillery or a large-scale spirit manufacturing facility, having a well-structured system to monitor your performance metrics can make all the difference.
That’s exactly where the Distillery KPI Dashboard in Google Sheets comes in — a ready-to-use, interactive, and customizable tool that helps distillery managers and teams track operational, production, and financial performance at a glance.
Click to buy Distillery KPI Dashboard in Google Sheets
What Is a Distillery KPI Dashboard in Google Sheets?
A Distillery KPI Dashboard is a performance-tracking system designed to help distilleries measure and analyze their key performance indicators (KPIs). Built in Google Sheets, this dashboard brings together multiple data points — from production volumes to energy usage — into a single visual interface.
With dynamic charts, monthly comparisons, and color-coded visuals, it transforms raw data into actionable insights. You don’t need advanced software or technical skills — this dashboard runs entirely in Google Sheets and can be accessed anytime, anywhere.
Structure of the Distillery KPI Dashboard in Google Sheets
This ready-to-use dashboard includes six well-designed worksheet tabs, each with a specific purpose. Let’s explore each sheet in detail.
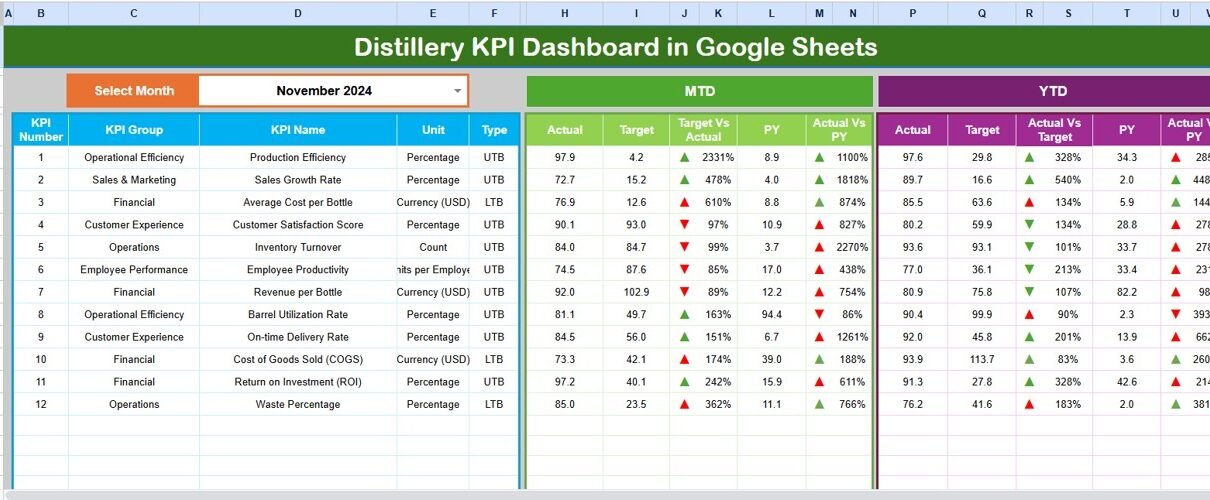
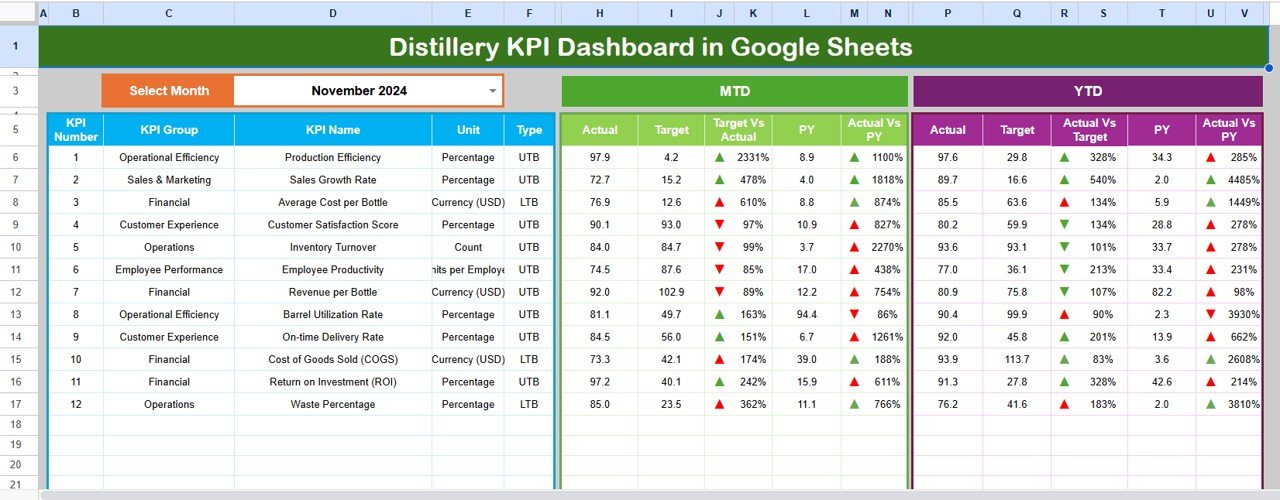
Dashboard Sheet Tab
The Dashboard sheet is the main control center of this template.
Here’s what makes it powerful:
- Month Selector (Cell D3): Easily switch between months to update all metrics instantly.
- Dynamic KPIs: Displays MTD (Month-to-Date) and YTD (Year-to-Date) performance.
- Visual Indicators: Conditional formatting with up/down arrows shows if performance is improving or declining.
- Comparisons: Automatically compares Actual vs Target and Actual vs Previous Year.
- Color Coding: Quickly identify under-performing or over-achieving KPIs with color cues.
This page provides a snapshot of overall business performance — ideal for presentations, management meetings, and performance reviews.
Click to buy Distillery KPI Dashboard in Google Sheets
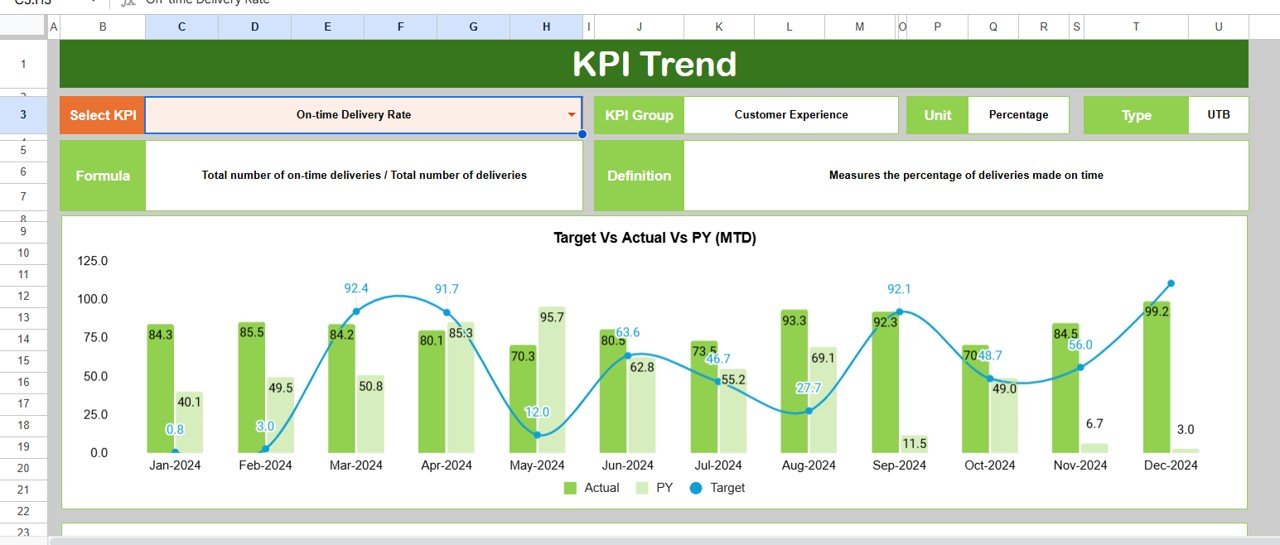
Trend Sheet Tab
The Trend sheet tab focuses on visual analysis and performance trends.
- Dropdown KPI Selection (Cell C3): Choose a KPI to analyze its performance across months.
- KPI Details: Shows KPI Group, Unit, Formula, and Type (UTB – Upper the Better or LTB – Lower the Better).
- Trend Charts: Visualize MTD and YTD data for Actual, Target, and Previous Year.
This makes it easy to track seasonality, identify recurring issues, and monitor continuous improvement efforts.
Click to buy Distillery KPI Dashboard in Google Sheets
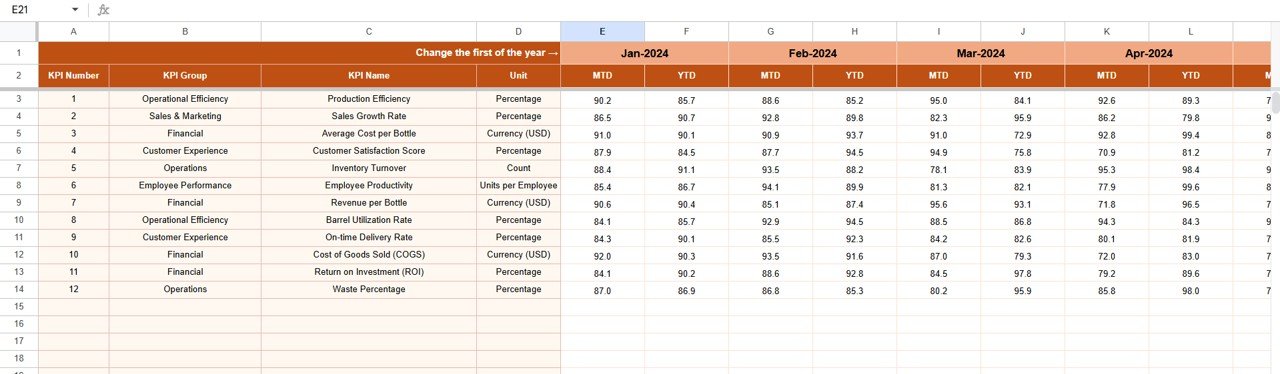
Actual Numbers Input Sheet
This sheet captures all actual performance data.
Key features include:
- Month Control (Cell E1): Select the first month of the year to organize data properly.
- Data Entry Fields: Record MTD and YTD values for every KPI.
- Automatic Calculations: Dashboard and charts update automatically once data is entered.
By maintaining this sheet regularly, you can ensure your dashboard always reflects real-time performance.
Click to buy Distillery KPI Dashboard in Google Sheets
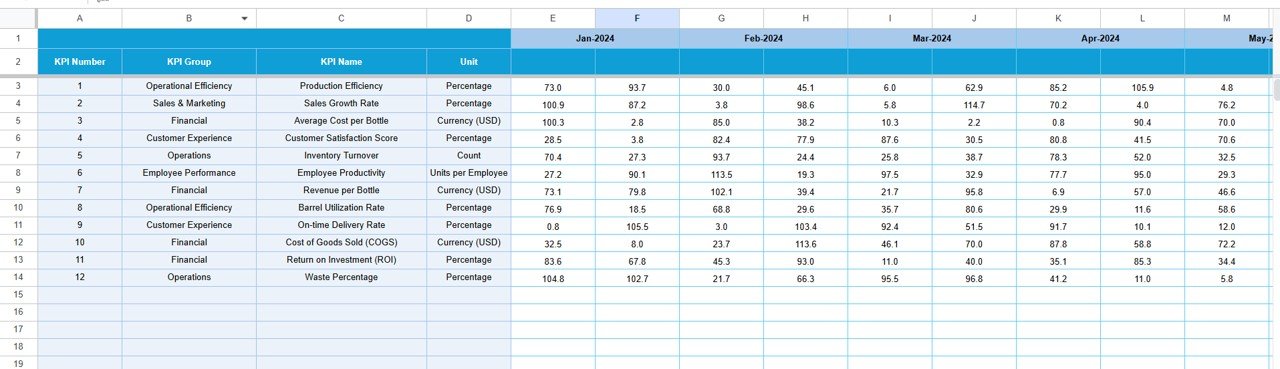
Target Sheet Tab
The Target sheet defines what success looks like.
Here’s what you do here:
- Input monthly targets for both MTD and YTD values for each KPI.
- Adjust targets based on production goals, budget limits, or seasonal variations.
- Keep your targets realistic yet challenging to encourage team performance.
This helps ensure your goals are aligned with your company’s strategy and capacity.
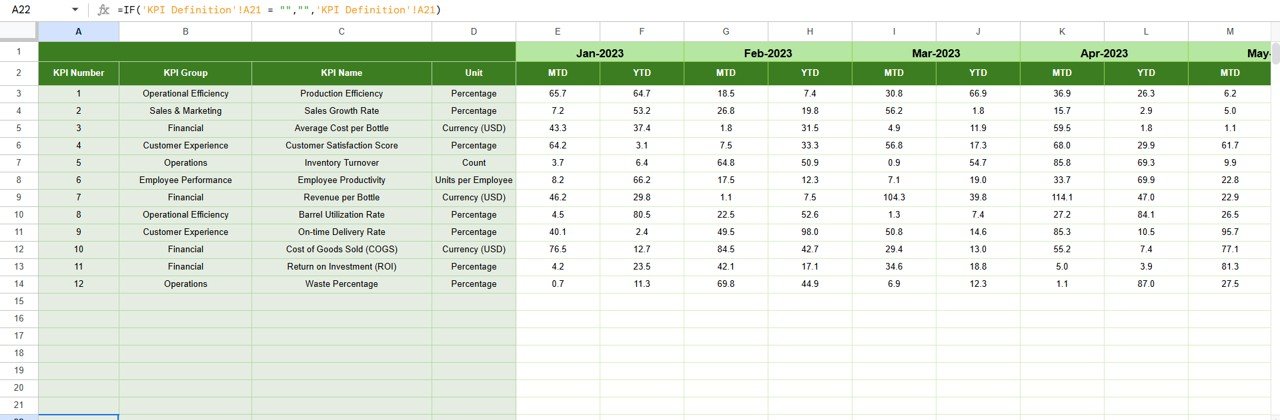
Previous Year Numbers Sheet
Historical data plays a critical role in performance comparison.
This sheet stores previous year’s data, mirroring the format of the current year’s input sheet.
Benefits include:
- Understanding year-over-year growth.
- Identifying performance gaps.
- Setting realistic benchmarks based on actual past trends.
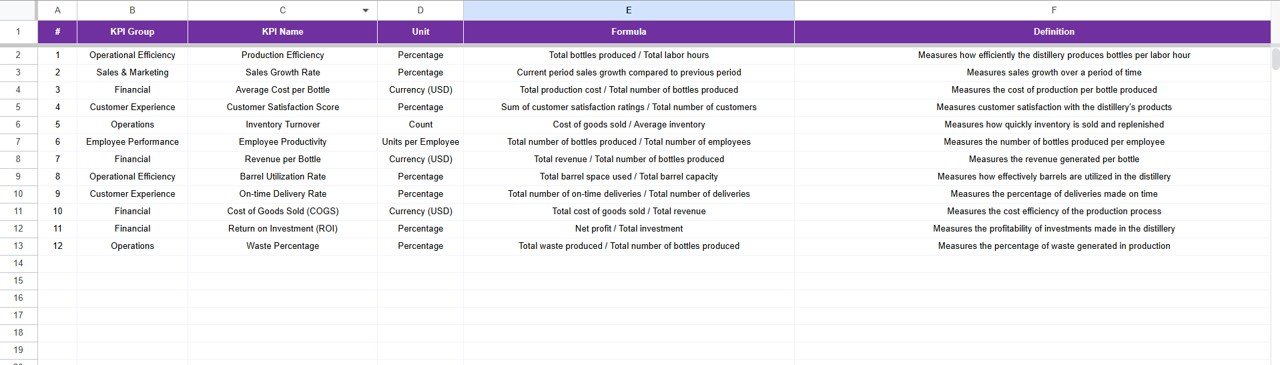
KPI Definition Sheet Tab
The KPI Definition sheet acts as the foundation of your dashboard.
Each KPI includes:
- KPI Group: Category (Production, Quality, Safety, Finance, etc.).
- KPI Name and Unit: Clearly define what’s being measured and in which unit.
- Formula: Simple calculation for performance measurement.
- Definition: Short description explaining the KPI’s purpose.
- Type: Classify as UTB (Upper the Better) or LTB (Lower the Better).
This sheet ensures everyone in your team interprets KPIs consistently.
Why Every Distillery Needs a KPI Dashboard
Running a distillery involves multiple processes — fermentation, distillation, blending, packaging, and distribution. Each stage affects cost, quality, and yield. Without proper tracking, it’s easy to lose visibility over where performance drops occur.
A Distillery KPI Dashboard in Google Sheets centralizes this information and empowers management to make data-driven decisions.
Here are a few major benefits:
- Gain real-time visibility into production and operational performance.
- Identify bottlenecks and inefficiencies quickly.
- Monitor cost per liter, yield efficiency, and waste reduction.
- Measure quality metrics like alcohol purity and defect rate.
- Compare current performance with past months or years.
- Align KPIs with strategic goals such as sustainability and profitability.
Key Performance Indicators (KPIs) You Can Track
A well-built distillery dashboard should include a balanced mix of operational, quality, financial, and environmental KPIs.
Here are some essential examples:
Production KPIs
- Production Volume (Liters)
- Distillation Efficiency (%)
- Batch Yield Rate (%)
- Downtime Hours
- Energy Consumption (kWh per Liter)
Quality KPIs
- Alcohol Purity (%)
- Defect Rate (%)
- Product Rework Count
- QC Pass Percentage (%)
Financial KPIs
- Cost per Liter ($)
- Revenue per Batch ($)
- Profit Margin (%)
- Waste Cost ($)
Sustainability KPIs
- Water Usage (Liters per Liter of Output)
- CO₂ Emission per Batch (kg)
- Recycling Efficiency (%)
By integrating these KPIs, distilleries can balance quality, sustainability, and profitability in one place.
How to Use the Distillery KPI Dashboard Effectively
To make the most of this Google Sheets dashboard, follow these simple steps:
- Set Up Your Data Sources: Gather all monthly KPI data from production, finance, and quality teams.
- Update Actuals: Enter MTD and YTD figures in the Actual Numbers Input Sheet.
- Update Targets: Set realistic targets in the Target Sheet.
- Add Historical Data: Fill in last year’s results in the Previous Year Numbers Sheet.
- Review Dashboard: View real-time metrics on the Dashboard Sheet and check trends using the Trend Sheet.
- Analyze Gaps: Focus on KPIs with declining trends or red arrows (below target).
- Take Action: Adjust processes, allocate resources, and track improvement monthly.
Advantages of Using the Distillery KPI Dashboard in Google Sheets
Implementing this tool brings multiple operational and strategic benefits:
- Centralized and Cloud-Based
You can access and edit the dashboard from anywhere, making it ideal for teams working across different shifts or locations.
- Real-Time Updates
Any data change reflects instantly across charts and tables. This saves time and improves accuracy.
- Easy to Customize
Add or remove KPIs, modify visuals, and adjust layout based on your unique distillery operations.
- Cost-Effective Solution
Unlike expensive BI tools, Google Sheets is free and user-friendly.
- Improved Decision-Making
With visual indicators and trend charts, management can identify issues and act faster.
- Enhanced Collaboration
Team members can work together in real time, reducing communication delays.
Best Practices for Using the Distillery KPI Dashboard
To ensure your dashboard delivers consistent and actionable insights, follow these best practices:
- Keep KPIs SMART: Specific, Measurable, Achievable, Relevant, and Time-bound.
- Update Data Monthly: Maintain the accuracy of MTD and YTD comparisons.
- Use Color Coding Wisely: Red for below-target, green for on-track KPIs.
- Limit KPI Count: Focus on the most impactful 12-15 KPIs for clarity.
- Automate Where Possible: Use Google Sheets formulas like AVERAGE, SUMIFS, and SPARKLINE for trend viuals.
- Secure Access: Restrict edit permissions to prevent accidental data changes.
- Review Quarterly: Revisit your KPI definitions and targets to stay aligned with business goals.
Conclusion
The Distillery KPI Dashboard in Google Sheets offers a simple yet powerful way to monitor your production, quality, and financial metrics. It transforms your everyday data into meaningful business insights, allowing your distillery to stay competitive, efficient, and profitable.
By following the best practices, regularly updating your data, and interpreting visual cues, you can achieve operational excellence and strategic growth — all using the familiar, accessible interface of Google Sheets.
❓ Frequently Asked Questions (FAQs)
- What is a KPI in the context of a distillery?
A KPI (Key Performance Indicator) is a measurable value that shows how effectively your distillery is achieving its operational and strategic goals. Examples include production yield, cost per liter, and energy consumption.
- Why use Google Sheets for a KPI dashboard?
Google Sheets offers flexibility, collaboration, and accessibility without requiring costly software. It’s ideal for small to mid-sized distilleries that want real-time visibility of their performance.
- How often should I update the dashboard?
You should update the MTD and YTD data monthly to keep trends accurate and actionable.
- Can I customize the KPIs in this dashboard?
Yes. You can add, edit, or remove KPIs in the KPI Definition Sheet. Adjust formulas or add new charts as per your needs.
- Is technical knowledge required to use it?
No. This template is designed for non-technical users. Basic knowledge of Google Sheets is enough to operate it.
- What types of distilleries can use this dashboard?
Any distillery — from small craft producers to large spirit manufacturers — can benefit from it. The dashboard is fully customizable for whisky, rum, gin, vodka, or liqueur operations.
- How do I download this template?
You can download the ready-to-use Distillery KPI Dashboard in Google Sheets from NextGenTemplates.com. It’s plug-and-play — just input your data and start analyzing instantly.
Visit our YouTube channel to learn step-by-step video tutorials