Employee productivity plays a major role in the success of any organization. When employees perform well, teams deliver better results, deadlines stay under control, and business growth becomes consistent. However, tracking productivity manually often leads to errors, delays, and confusion. Because of this, more companies rely on digital dashboards to measure performance accurately. One of the best and most affordable tools for this purpose is the Employee Productivity Tracking KPI Dashboard in Google Sheets.
This dashboard helps you track performance indicators, analyze employee efficiency, compare actual numbers with targets, and monitor year-over-year growth. It provides a single place where managers, HR teams, and department heads can analyze employee contribution month after month.Employee Productivity Tracking KPI Dashboard in Google Sheets
In this detailed article, we explore KPIs, dashboard structure, advantages, opportunities for improvement, best practices, and FAQs. The goal is to give you a complete understanding of how the Employee Productivity Tracking KPI Dashboard in Google Sheets works and how it improves organizational efficiency.Employee Productivity Tracking KPI Dashboard in Google Sheets
What Is an Employee Productivity Tracking KPI Dashboard?
Click to Buy Employee Productivity Tracking KPI Dashboard in Google Sheets
An Employee Productivity Tracking KPI Dashboard is a performance monitoring system that measures how employees contribute to business goals. It collects important metrics such as attendance, efficiency, work quality, task delivery, and revenue contribution.Employee Productivity Tracking KPI Dashboard in Google Sheets
Because this dashboard runs in Google Sheets, you can:Employee Productivity Tracking KPI Dashboard in Google Sheets
- Access it from any device
- Share it with your team
- Update it in real time
- Collaborate easily
- Use formulas, dropdowns, and charts
This makes productivity tracking simpler, faster, and far more accurate.
Why Use Google Sheets for Employee Productivity Tracking?
Google Sheets gives you several advantages:
- Cloud-Based Access: You can open the dashboard anywhere with an internet connection.
- Real-Time Collaboration: Multiple users can work together at the same time.
- No Installation Required: Google Sheets works directly in the browser.
- Easy Customization: You can adjust formulas, add new KPIs, or modify layouts without technical knowledge.
- Cost-Effective: You do not need expensive software or licensing fees.
Because of these benefits, many organizations choose Google Sheets for tracking employee productivity.
Dashboard Structure Explained
Your Employee Productivity Tracking KPI Dashboard in Google Sheets comes with six worksheets. Each tab serves a unique purpose and ensures a smooth workflow.
Below is a complete explanation of each sheet:
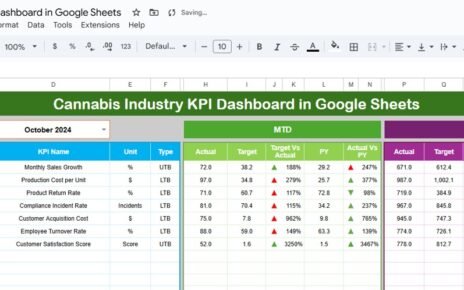
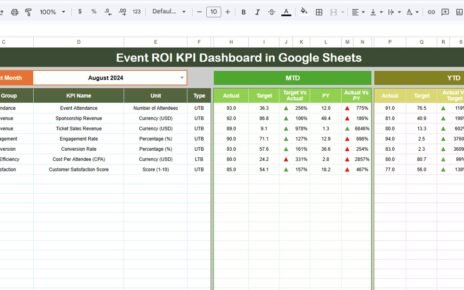
1. Dashboard Sheet Tab (Main Page)
This is the first sheet that users interact with. It gives a complete summary of all KPIs in a clean and visual format.
Key Features:
-
Month selection available in Range D3
-
All KPIs update instantly when the month changes
-
Shows MTD (Month-to-Date) numbers
-
Shows YTD (Year-to-Date) numbers
-
Displays Target, Actual, and Previous Year values
-
Includes conditional formatting with green arrows for positive performance and red arrows for negative performance
What You Will See Here:
-
MTD Actual vs MTD Target
-
MTD Actual vs MTD Previous Year
-
YTD Actual vs YTD Target
-
YTD Actual vs YTD Previous Year
This page works like a command center. Managers can quickly identify performance gaps, track employee strengths, and monitor improvement areas.
Click to Buy Employee Productivity Tracking KPI Dashboard in Google Sheets
2. KPI Trend Sheet Tab
This sheet helps users dive deeper into the performance of a specific KPI.
How It Works:
Select any KPI from the dropdown in Range C3
The dashboard displays:
- KPI Group
- Unit
- KPI Type (Upper the Better OR Lower the Better)
- Formula
- Definition
A trend chart shows KPI performance across months
This page helps managers understand patterns, identify productivity fluctuations, and set better targets.
Click to Buy Employee Productivity Tracking KPI Dashboard in Google Sheets
3. Actual Number Sheet Tab
In this sheet, you must enter the actual numbers for each KPI.
Key Features:
-
Select the required month in Range E1
-
Enter both MTD and YTD data
-
Data automatically flows into the dashboard
This sheet ensures accurate reporting and helps teams maintain clean data.
4. Target Sheet Tab
Setting the right target is important for productivity measurement. This sheet keeps all monthly and yearly target values.
Data to Enter:
-
MTD Target
-
YTD Target
When you update this sheet, the dashboard updates instantly. This makes it easy to review performance against goals.
Click to Buy Employee Productivity Tracking KPI Dashboard in Google Sheets
5. Previous Year Number Sheet Tab
This sheet stores the previous year’s numbers for all KPIs.
Why It’s Important:
-
Helps compare current year performance
-
Allows year-over-year growth tracking
-
Shows improvements or drops in productivity
Understanding past performance helps in planning future strategies.
6. KPI Definition Sheet Tab
This is the base sheet for the dashboard. It contains full details of every KPI.
Columns Included:
- KPI Name
- KPI Group
- Unit
- Formula
- KPI Definition
- Type: Lower the Better (LTB) or Upper the Better (UTB)
Below is the complete KPI list for your dashboard.
Click to Buy Employee Productivity Tracking KPI Dashboard in Google Sheets
Advantages of Employee Productivity Tracking KPI Dashboard
This dashboard brings several benefits for organizations:
- Real-Time Performance Monitoring: The dashboard updates instantly as new data comes in.
- Easy Comparison: Compare Actual vs Target and Actual vs Previous Year in one click.
- Improved Accountability: Employees understand expectations clearly.
- Enhanced Team Performance: Managers can spot high performers and support low performers.
- Better Resource Planning: You can identify workloads, overtime needs, and staffing gaps.
- Data-Driven Decision Making: The dashboard gives meaningful insights for HR and management.
- Cost Efficiency: Google Sheets reduces the need for expensive tools.
Opportunities for Improvement
Click to Buy Employee Productivity Tracking KPI Dashboard in Google Sheets
Although this dashboard is powerful, you can make it even better with a few enhancements:
- Automated Alerts: Send emails when performance drops below target.
- Integration with Timesheet Tools: Link data from tools like Toggl, Clockify, or Jira.
- Dynamic Role-Based Access: Limit what each team can view or edit.
- Add a Cost Analysis: Track salary vs productivity ratio.
- Add a Workflow Tracker: Monitor daily or weekly workloads more closely.
- Predictive Analytics: Forecast productivity trends using formulas and scripts.
Best Practices for Using the Dashboard
To get the best results, follow these practices:
- Update Data Monthly: Keep Actual, Target, and Previous Year data fresh.
- Standardize KPI Definitions: Ensure every KPI follows a clear formula.
- Encourage Team Participation: Let employees view their performance.
- Use Conditional Formatting Effectively: Highlight problem areas instantly.
- Back Up Data Regularly: Keep a copy of your dashboard each month.
- Analyze Trend Charts: Identify patterns and seasonal fluctuations.
- Review Targets Periodically; Adjust targets based on workload and business needs.
Conclusion
Click to Buy Employee Productivity Tracking KPI Dashboard in Google Sheets
The Employee Productivity Tracking KPI Dashboard in Google Sheets is a complete solution for monitoring employee performance. It gives you clear insights, tracks progress, compares results with targets, and highlights areas for improvement. Because it runs on Google Sheets, it is easy to use, highly flexible, and perfect for growing teams.Employee Productivity Tracking KPI Dashboard in Google Sheets
With the right KPIs and consistent data entry, this dashboard becomes a powerful tool for performance improvement and organizational success.Employee Productivity Tracking KPI Dashboard in Google Sheets
Frequently Asked Questions (FAQs)
1. What is an Employee Productivity Tracking KPI Dashboard?
It is a Google Sheets tool that tracks employee performance across multiple KPIs such as efficiency, productivity, attendance, and quality.
2. Who can use this dashboard?
HR teams, managers, team leads, and business owners.
3. Can I add more KPIs?
Yes, you can add new KPIs in the KPI Definition Sheet anytime.
4. Does the dashboard support trend analysis?
Yes, the KPI Trend sheet shows monthly performance charts.
5. Can the dashboard compare performance with previous year?
Yes, the dashboard includes actual, target, and previous year comparisons.
6. What do UTB and LTB mean?
UTB = Upper the Better
LTB = Lower the Better
7. Is the dashboard customizable?
Yes, you can modify all sheets, KPIs, and charts as per your needs.
Visit our YouTube channel to learn step-by-step video tutorials
Youtube.com/@NeotechNavigators
Watch the step-by-step video Demo:
Click to Buy Employee Productivity Tracking KPI Dashboard in Google Sheets