Energy management has become a top priority for every organization. Costs keep rising. Sustainability goals become stricter. Meanwhile, companies must reduce carbon emissions while improving efficiency.
However, many businesses still track energy data in scattered spreadsheets. As a result, managers struggle to monitor real performance.
So, how can you track energy consumption, savings, CO₂ emissions, project progress, and efficiency scores in one structured dashboard?
The answer is simple.
You need an Energy Dashboard in Google Sheets.
This ready-to-use dashboard helps you monitor operational and sustainability metrics in real time. Moreover, it updates instantly when you apply filters like Month, Department, Project Type, Region, and Status.
Let us explore everything step by step.
What Is an Energy Dashboard in Google Sheets?
An Energy Dashboard in Google Sheets is an interactive performance monitoring system designed to track:
- Energy consumption
- Budgeted energy usage
- Energy savings
- CO₂ emissions
- Project completion
- Efficiency score
Instead of using multiple reports, you can manage everything inside one centralized dashboard. Additionally, because Google Sheets works in the cloud, teams collaborate easily across locations.
What Key KPIs Does This Energy Dashboard Track?
Click to Buy Energy Dashboard in Google Sheets
The dashboard highlights critical energy and sustainability metrics.
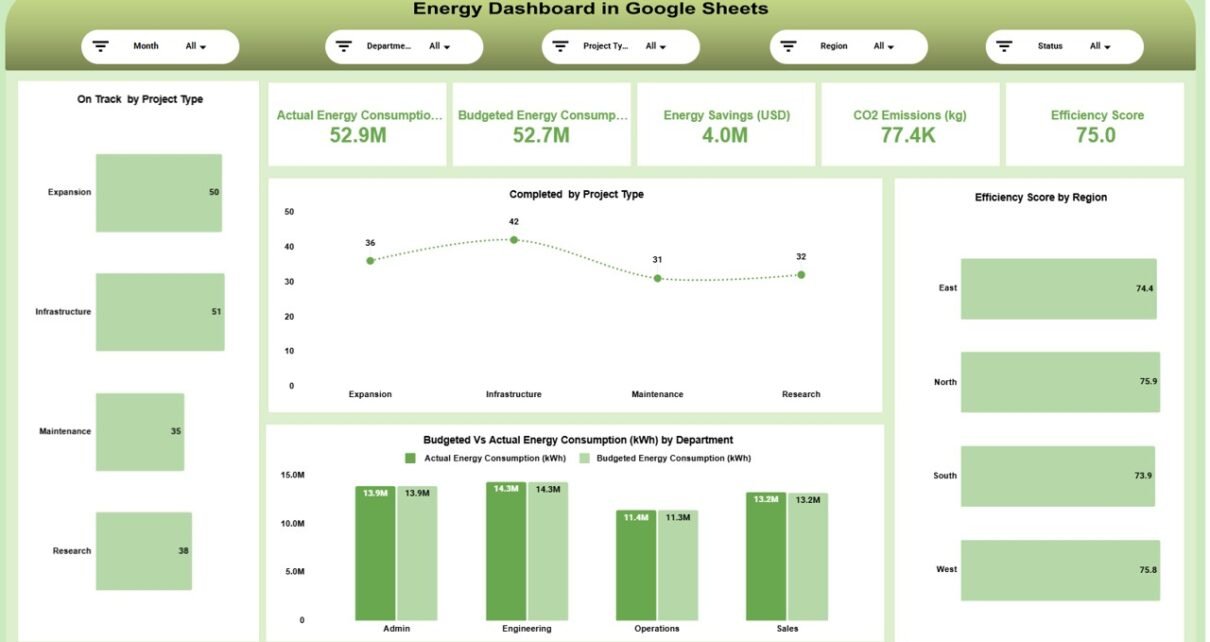
Core Summary KPIs
-
Actual Energy Consumption: 52.9M kWh
-
Budgeted Energy Consumption: 52.7M kWh
-
Energy Savings (USD): 4.0M
-
CO₂ Emissions (kg): 77.4K
-
Efficiency Score: 75.0
These summary cards provide a quick snapshot of overall energy performance.
How Do the Filters Improve Analysis?
At the top of the dashboard, you can filter by:
- Month
- Department
- Project Type
- Region
- Status
Once you apply a filter, all charts update automatically. Therefore, you can analyze specific regions, departments, or projects instantly.
Main Dashboard Overview
The main page provides a complete energy snapshot.
- On Track by Project Type
- Completed by Project Type
- Budgeted vs Actual Energy Consumption by Department
- Efficiency Score by Region

Click to Buy Energy Dashboard in Google Sheets
Department Analysis Page
This page focuses on departmental performance.
- Energy Savings by Department
- Completed by Department
- CO₂ Emissions by Department
- Efficiency Score by Department

Click to Buy Energy Dashboard in Google Sheets
Region Analysis Page
The Region Analysis page provides geographical insights.
- Energy Savings by Region
- CO₂ Emissions by Region
- Completed Projects by Region
- Efficiency Score by Region

Project Analysis Page
- Energy Savings by Project Type
- CO₂ Emissions by Project Type
- Efficiency Score by Project Type

Click to Buy Energy Dashboard in Google Sheets
Monthly Trends Page
Monthly tracking provides time-based insights.
- Energy Savings by Month
- CO₂ Emissions by Month
- Efficiency Score by Month

Advantages of Energy Dashboard in Google Sheets
Click to Buy Energy Dashboard in Google Sheets
Real-Time Energy Monitoring
You track consumption instantly.
Budget vs Actual Comparison
You identify energy overuse quickly.
Sustainability Tracking
You monitor CO₂ emissions clearly.
Financial Savings Analysis
You measure cost savings accurately.
Project Performance Tracking
You evaluate project completion effectively.
Cloud-Based Accessibility
You access data anytime.
Data-Driven Decisions
You rely on clear performance metrics.
Best Practices for Using the Energy Dashboard
Click to Buy Energy Dashboard in Google Sheets
To maximize results, follow these best practices:
Update Data Monthly
Maintain regular updates.
Validate Consumption Numbers
Ensure accurate meter readings.
Align KPIs with Sustainability Goals
Support environmental targets.
Monitor High-Emission Areas
Take corrective action quickly.
Review Efficiency Scores Regularly
Improve underperforming departments.
Set Clear Budget Targets
Control energy costs effectively.
How Does This Dashboard Support Sustainability Goals?
Click to Buy Energy Dashboard in Google Sheets
Because it tracks CO₂ emissions, energy savings, and efficiency, this dashboard supports:
- Carbon reduction programs
- ESG reporting
- Green certification tracking
- Energy optimization strategies
Therefore, it strengthens both operational and environmental performance.
Conclusion
Energy management requires structured monitoring. However, manual tracking creates confusion and delays.
The Energy Dashboard in Google Sheets provides centralized reporting, real-time filtering, budget comparison, emission tracking, and performance analysis in one powerful solution.
Because it combines operational, financial, and sustainability metrics, it delivers complete visibility.
If you want to reduce energy costs, improve efficiency, and meet sustainability goals, this dashboard provides a practical and effective solution.
Frequently Asked Questions (FAQs)
Click to Buy Energy Dashboard in Google Sheets
What is an Energy Dashboard in Google Sheets?
It is a structured template that tracks energy consumption, savings, emissions, and efficiency metrics.
Can I customize KPIs?
Yes. You can modify departments, regions, and project types.
Does it support sustainability reporting?
Yes. It tracks CO₂ emissions and efficiency scores.
Do I need advanced skills?
No. Basic Google Sheets knowledge is enough.
Can it track multiple regions?
Visit our YouTube channel to learn step-by-step video tutorials
Youtube.com/@NeotechNavigators
Watch the step-by-step video tutorial: