Organizations across the world now focus heavily on sustainability, social responsibility, and ethical governance. Investors, regulators, customers, and employees expect companies to measure and report ESG performance transparently. However, ESG data often remains scattered across departments, spreadsheets, and reports, which makes tracking and analysis difficult.
This challenge makes an ESG (Environmental, Social, and Governance) KPI Dashboard in Google Sheets extremely valuable.
This ready-to-use dashboard helps organizations track ESG performance using structured KPIs, clear targets, historical comparisons, and visual indicators. Because it is built in Google Sheets, teams can collaborate easily while maintaining full transparency.
In this article, we explain how the dashboard works, its worksheet structure, a complete ESG KPI list with units and formulas, and best practices for ESG reporting.
What Is an ESG KPI Dashboard in Google Sheets?
Click to Buy ESG (Environmental, Social, and Governance) KPI Dashboard in Google Sheets
An ESG KPI Dashboard is a performance management tool designed to monitor Environmental, Social, and Governance indicators in a structured and measurable way. It helps organizations track sustainability goals, social impact, and governance compliance using data-driven metrics.
Because this dashboard uses Google Sheets, it offers:
-
Centralized ESG reporting
-
Easy collaboration across teams
-
Real-time KPI updates
-
No expensive BI tools
-
Transparent KPI definitions
This dashboard suits sustainability teams, ESG officers, finance teams, compliance teams, and leadership.
Key Features of the ESG KPI Dashboard
The dashboard includes 6 structured worksheet tabs, each designed to support accurate ESG performance tracking.
Dashboard Sheet Tab (Main Dashboard)
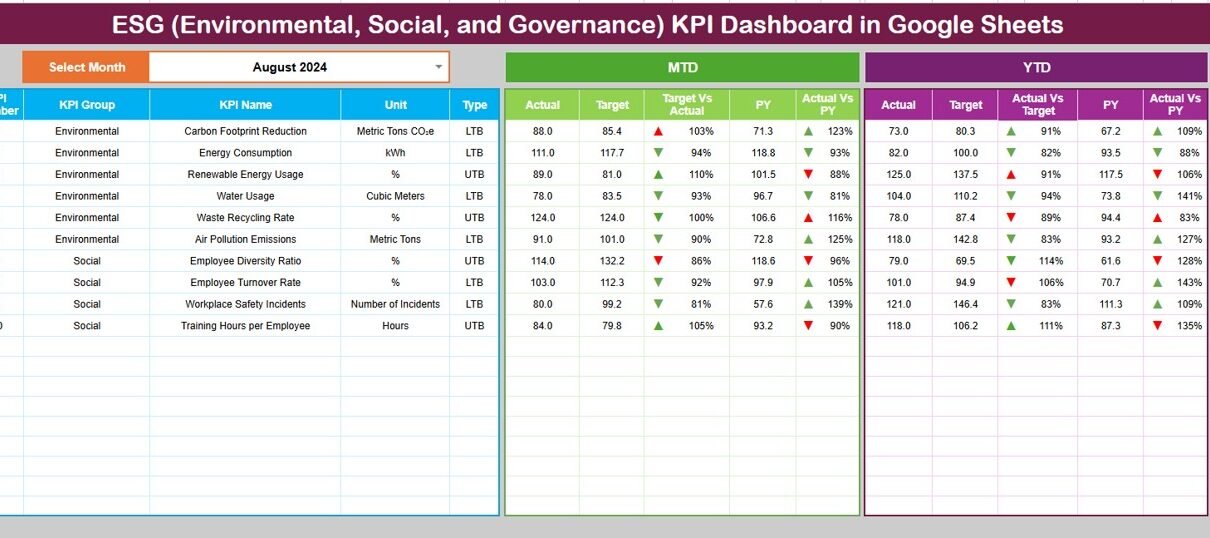
The Dashboard Sheet provides a consolidated ESG performance view.
-
Select the month from the dropdown in cell D3
-
All KPI values update automatically for the selected month
Metrics displayed:
MTD (Month-to-Date)
-
Actual
-
Target
-
Previous Year
-
Target vs Actual
-
Previous Year vs Actual
YTD (Year-to-Date)
-
Actual
-
Target
-
Previous Year
-
Target vs Actual
-
Previous Year vs Actual
Conditional formatting with up and down arrows clearly highlights improvement or decline.
This sheet supports management reviews and ESG reporting discussions.

Click to Buy ESG (Environmental, Social, and Governance) KPI Dashboard in Google Sheets
KPI Trend Sheet Tab
The KPI Trend Sheet allows deep analysis of individual ESG KPIs.
-
Select a KPI from the dropdown in cell C3
The sheet displays:
-
KPI Group (Environmental / Social / Governance)
-
Unit of Measurement
-
KPI Type (Upper the Better / Lower the Better)
-
KPI Formula
-
KPI Definition
You also see month-wise KPI trends to understand progress over time.

Click to Buy ESG (Environmental, Social, and Governance) KPI Dashboard in Google Sheets
Actual Number Sheet Tab
This sheet captures actual ESG performance data.
-
Select the first month of the year in cell E1
-
Enter MTD and YTD actual values for each KPI
The dashboard updates automatically once data is entered.

Target Sheet Tab
The Target Sheet stores ESG goals.
-
Monthly (MTD) targets
-
Annual (YTD) targets
Targets help organizations align ESG performance with sustainability commitments and regulatory expectations.

Click to Buy ESG (Environmental, Social, and Governance) KPI Dashboard in Google Sheets
Previous Year Number Sheet Tab
This sheet stores previous year ESG data.
It enables:
-
Year-over-Year ESG comparison
-
Trend benchmarking
-
Performance improvement tracking

KPI Definition Sheet Tab
The KPI Definition Sheet acts as the foundation of the dashboard.
It includes:
-
KPI Name
-
KPI Group
-
Unit
-
Formula
-
KPI Definition
-
KPI Type (UTB / LTB)
This ensures consistency and audit readiness.

Click to Buy ESG (Environmental, Social, and Governance) KPI Dashboard in Google Sheets
Advantages of ESG KPI Dashboard in Google Sheets
-
Centralized ESG reporting
-
Clear target vs actual comparison
-
Improved transparency
-
Easier regulatory reporting
-
Better sustainability decision-making
-
Cost-effective reporting solution
Opportunities for Improvement in ESG Tracking
-
Integrate carbon accounting tools
-
Add supplier ESG scoring
-
Track Scope 3 emissions
-
Automate data imports
-
Add ESG risk heatmaps
-
Align KPIs with global frameworks (GRI, SASB)
Best Practices for Using the ESG KPI Dashboard
Click to Buy ESG (Environmental, Social, and Governance) KPI Dashboard in Google Sheets
-
Define ESG KPIs clearly
-
Align targets with corporate strategy
-
Update data consistently
-
Review trends quarterly
-
Validate data sources
-
Document assumptions
Conclusion
An ESG (Environmental, Social, and Governance) KPI Dashboard in Google Sheets provides organizations with a simple yet powerful way to measure sustainability, social impact, and governance performance. By combining MTD, YTD, targets, and historical comparisons, the dashboard turns ESG data into actionable insights. Because it runs in Google Sheets, it remains accessible, transparent, and easy to manage.
For organizations committed to responsible growth, this dashboard becomes an essential ESG reporting tool.
Frequently Asked Questions (FAQs)
Click to Buy ESG (Environmental, Social, and Governance) KPI Dashboard in Google Sheets
1. Who should use this ESG dashboard?
ESG teams, sustainability officers, finance teams, and leadership.
2. Can ESG KPIs be customized?
Yes, all KPIs and formulas are editable.
3. Does it support regulatory reporting?
Yes, it supports structured ESG disclosures.
4. Can it handle multi-location data?
Yes, with proper data structure.
5. Is Google Sheets secure for ESG data?
Yes, with access control and permissions.
6. Can this dashboard support investor reporting?
Yes, it provides clear and visual ESG insights.
Visit our YouTube channel to learn step-by-step video tutorials
Youtube.com/@NeotechNavigators
Watch the step-by-step video tutorial:
Click to Buy ESG (Environmental, Social, and Governance) KPI Dashboard in Google Sheets