Event management has evolved significantly in recent years. Today, organizers must track performance, monitor budgets, evaluate attendee satisfaction, and measure event success using data-driven insights. However, many event teams still rely on manual spreadsheets and scattered reports. As a result, they struggle to evaluate performance accurately and make timely improvements.
Therefore, organizations increasingly adopt structured KPI scorecards to monitor event performance efficiently. One powerful and practical solution is the Event Management KPI Scorecard in Google Sheets — a ready-to-use performance monitoring tool designed to track key event metrics in a simple and interactive environment.
In this detailed guide, you will learn everything about the Event Management KPI Scorecard in Google Sheets, including its structure, features, benefits, implementation steps, best practices, and frequently asked questions.
What Is an Event Management KPI Scorecard in Google Sheets?
An Event Management KPI Scorecard in Google Sheets is a performance tracking system that monitors event success using Key Performance Indicators (KPIs). It converts raw event data into visual insights, allowing organizers to measure results quickly.
Instead of reviewing multiple reports, users can analyze performance from one centralized scorecard. Moreover, because Google Sheets works in the cloud, teams can access and update data from anywhere.
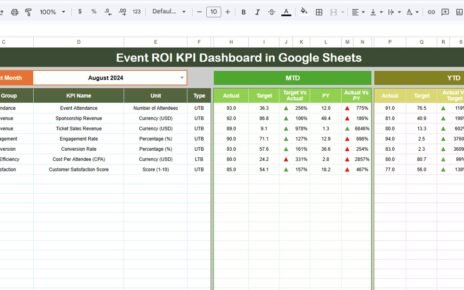
This ready-to-use template includes 10 different KPIs that measure event performance across financial, operational, and engagement areas.
Why Do Event Managers Need a KPI Scorecard?
Click to Buy Event Management KPI Scorecard In Google Sheets
Event planning involves multiple moving parts. For example, teams must manage registrations, budgets, sponsors, logistics, and attendee experience simultaneously. Without structured tracking, important insights remain hidden.
A KPI scorecard helps because it:
- Tracks performance in real time
- Measures success against targets
- Highlights improvement areas
- Supports data-driven decisions
- Improves event planning strategies
Consequently, organizers can continuously improve future events.
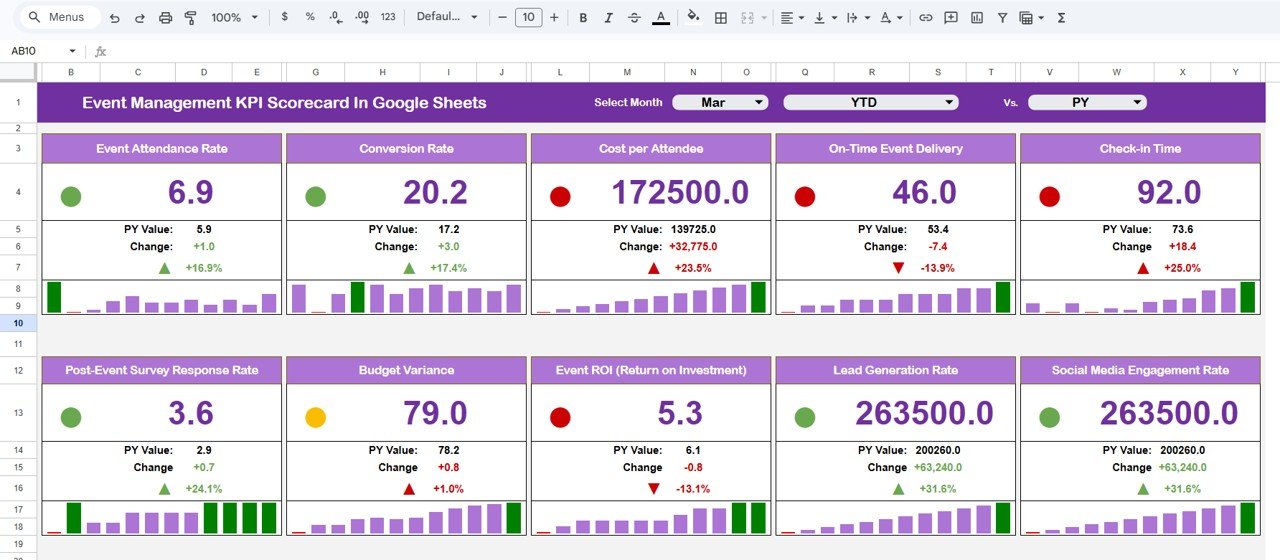
Key Features of Event Management KPI Scorecard in Google Sheets
This ready-to-use template provides automated analytics and visual indicators for performance evaluation.
Monthly Selection Dropdown
At the top of the scorecard, users can select any month using a dropdown menu. Once selected:
- The scorecard automatically updates numbers
- KPIs refresh instantly
- Performance indicators change dynamically
Therefore, users can analyze monthly performance without manual calculations.
MTD and YTD Analysis Options
Click to Buy Event Management KPI Scorecard In Google Sheets
The scorecard includes two analysis modes:
- MTD (Month-To-Date) – View monthly performance
- YTD (Year-To-Date) – View yearly performance trends
By clicking MTD or YTD, all metrics update automatically. As a result, decision-makers compare short-term and long-term performance easily.
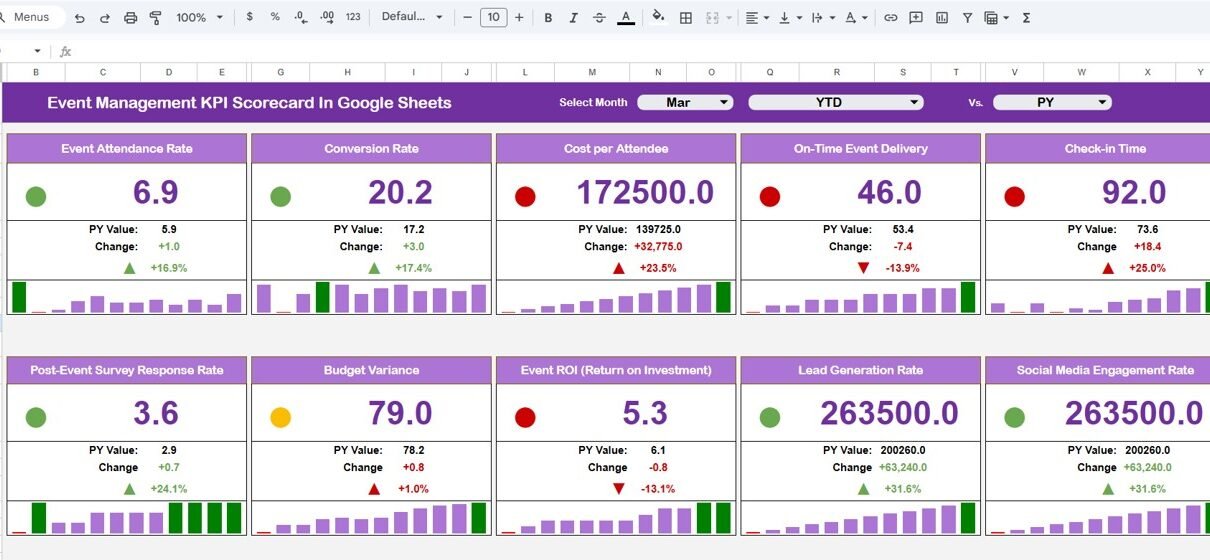
🚦 Traffic Light Performance Indicators
Visual indicators simplify performance evaluation.
The dashboard automatically shows:
-
🟢 Green – KPI performing well
-
🟡 Yellow – Needs attention
-
🔴 Red – Requires improvement
Additionally, up and down arrows display percentage change, helping users understand performance trends instantly.
Click to Buy Event Management KPI Scorecard In Google Sheets
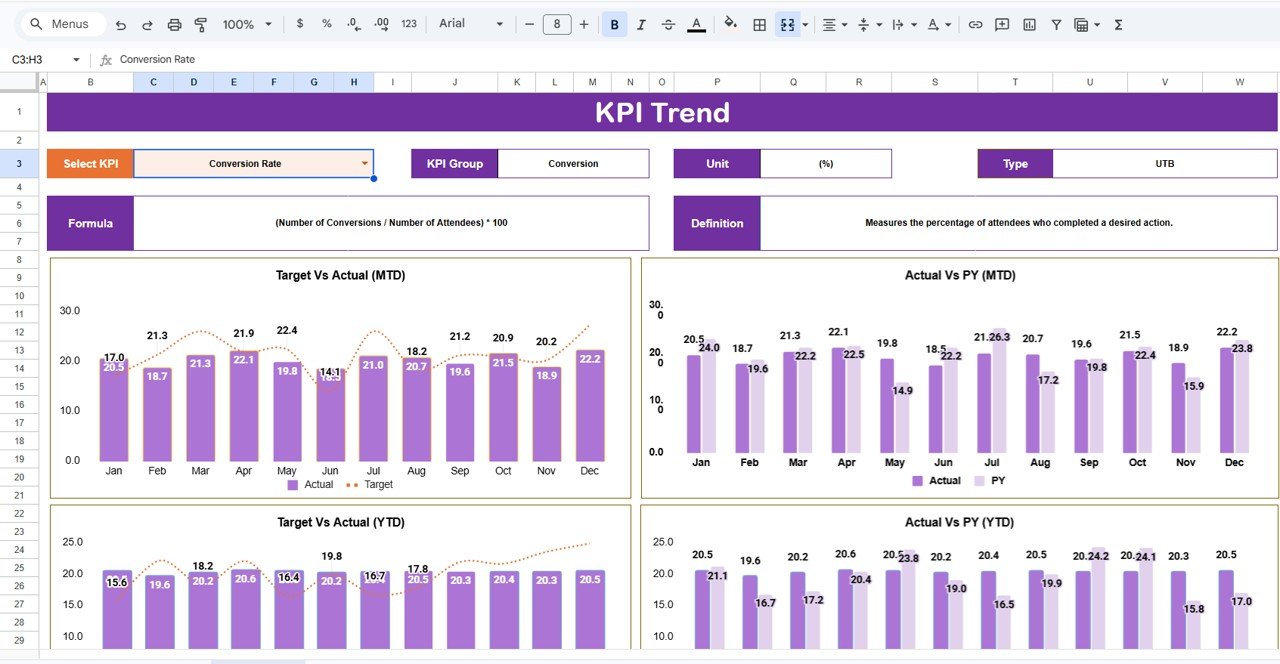
Trend Sheet
The Trend Sheet Tab provides deeper KPI insights.
Users can select a KPI from the dropdown available in cell range C3. Once selected, the sheet displays:
- KPI Group
- Unit of KPI
- Type of KPI
- Performance classification:
-
Lower the Better
-
Upper the Better
-
Click to Buy Event Management KPI Scorecard In Google Sheets
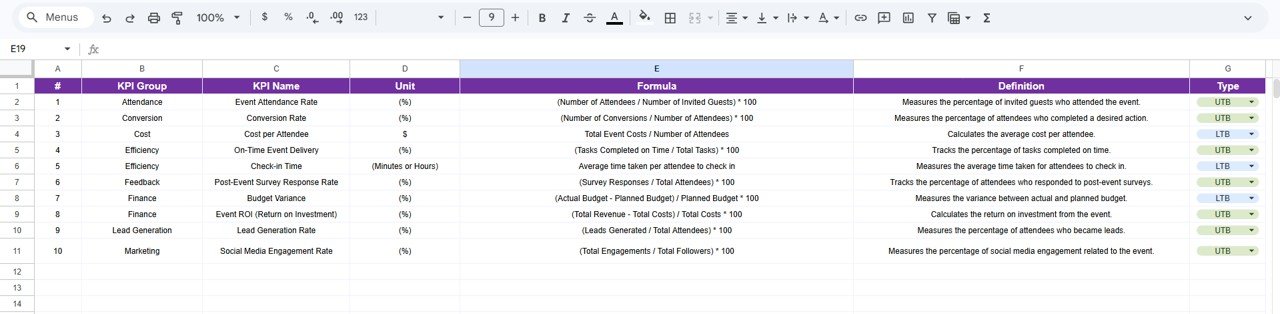
KPI Definition Sheet?
The KPI Definition Sheet acts as a central reference area.
In this sheet, users enter:
- KPI Name
- KPI Group
- Unit
- Formula
- KPI Definition
This structure ensures consistency across reporting. Furthermore, teams clearly understand how each KPI is calculated.
Click to Buy Event Management KPI Scorecard In Google Sheets
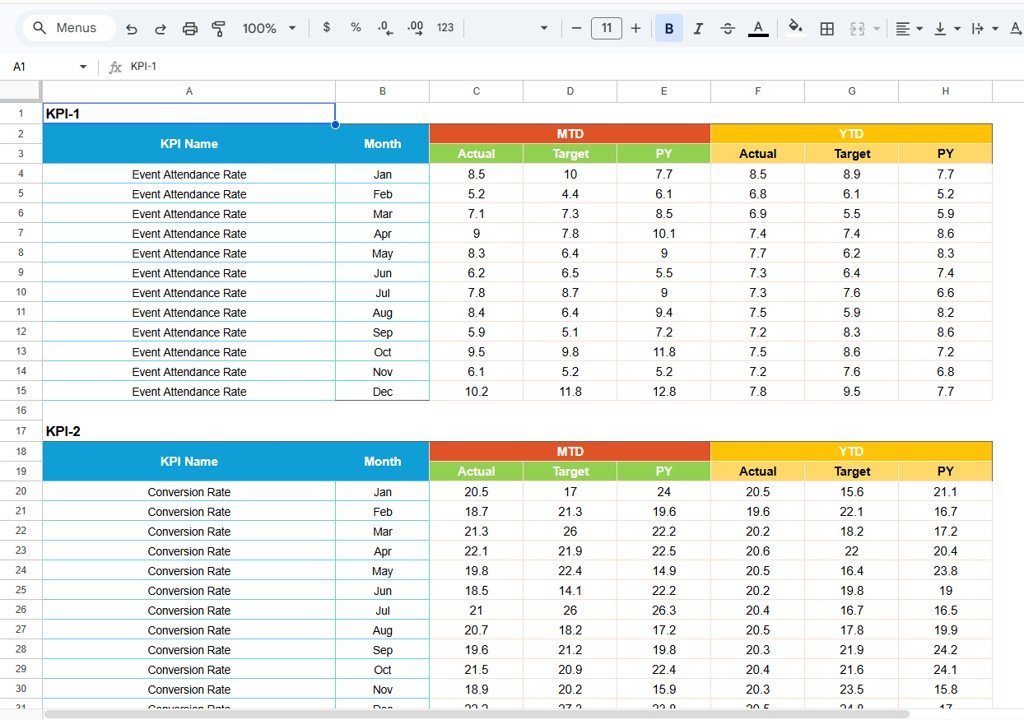
Data Input Sheet
The Data Input Sheet serves as the main data entry section.
Users input event-related performance data such as:
- Attendance numbers
- Revenue
- Costs
- Satisfaction scores
- Registrations
- Conversion rates
Once data is entered, the scorecard updates automatically. Therefore, users avoid manual reporting work.
Click to Buy Event Management KPI Scorecard In Google Sheets
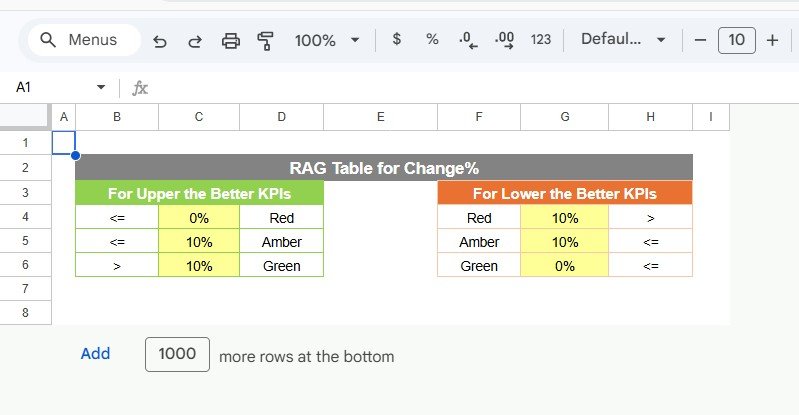
Color Settings
The Color Settings section controls dashboard visuals.
It allows users to:
- Define performance thresholds
- Customize traffic light indicators
- Maintain visual consistency
As a result, organizations align dashboard visuals with their performance standards.
Advantages of Event Management KPI Scorecard in Google Sheets
Using this scorecard provides several operational benefits.
Centralized Performance Monitoring
All KPIs appear in one dashboard, which simplifies analysis.
Real-Time Updates
Changes reflect immediately after data entry.
Easy Collaboration
Teams access the file online simultaneously.
Automated Calculations
Formulas reduce manual effort and errors.
Visual Decision Support
Traffic lights and arrows improve understanding.
Cost-Effective Solution
Google Sheets eliminates software costs.
Best Practices for the Event Management KPI Scorecard in Google Sheets
Click to Buy Event Management KPI Scorecard In Google Sheets
Organizations achieve better results when they follow proven practices.
Update Data Regularly
Frequent updates maintain dashboard accuracy.
Keep KPI Definitions Clear
Avoid confusion by documenting formulas.
Focus on Actionable Metrics
Track KPIs that influence decisions.
Review Trends Frequently
Analyze performance monthly and yearly.
Maintain Data Consistency
Use standardized data formats.
Train Team Members
Ensure everyone understands usage.
How Does This Scorecard Improve Event Planning?
Click to Buy Event Management KPI Scorecard In Google Sheets
The scorecard supports smarter planning because it:
- Identifies successful event strategies
- Highlights weak performance areas
- Improves budgeting accuracy
- Enhances attendee experience
- Supports continuous improvement
Therefore, each event becomes better than the previous one.
Who Should Use This Event Management KPI Scorecard?
This template benefits multiple roles:
- Event Managers
- Marketing Teams
- Corporate Event Planners
- Conference Organizers
- Nonprofit Event Coordinators
- Training Program Managers
- Business Analysts
Why Choose Google Sheets for KPI Scorecards?
Click to Buy Event Management KPI Scorecard In Google Sheets
Google Sheets offers several advantages:
- Cloud-based access
- Real-time collaboration
- Automatic saving
- Easy sharing
- Customization flexibility
Consequently, teams manage performance efficiently without technical complexity.
Conclusion
Event success depends on accurate performance measurement. Without structured analytics, organizations struggle to evaluate outcomes and improve future planning. The Event Management KPI Scorecard in Google Sheets provides a practical, user-friendly, and powerful solution for tracking event performance through measurable KPIs.
By combining automated calculations, dynamic filters, visual indicators, and trend analysis, this scorecard transforms raw event data into actionable insights. As a result, event teams improve efficiency, enhance attendee experiences, and achieve better outcomes consistently.
Organizations that adopt KPI-driven event management gain clarity, accountability, and strategic direction — all within a familiar Google Sheets environment.
Frequently Asked Questions (FAQs)
Click to Buy Event Management KPI Scorecard In Google Sheets
What is an Event Management KPI Scorecard?
It is a dashboard that tracks event performance using measurable KPIs and visual indicators.
How many KPIs are included in this template?
The template tracks 10 different KPIs to measure performance effectively.
Can I customize KPIs?
Yes, users can modify KPI definitions and formulas easily.
Do I need advanced Google Sheets skills?
No. The template works automatically after data entry.
What is the difference between MTD and YTD?
MTD shows monthly performance, while YTD shows yearly cumulative performance.
Can multiple users access the scorecard?
Yes, Google Sheets allows real-time collaboration.
How often should data be updated?
Organizations should update data after every event or monthly for best results.
Visit our YouTube channel to learn step-by-step video tutorials
Youtube.com/@NeotechNavigators
Watch the step-by-step video tutorial:
Click to Buy Event Management KPI Scorecard In Google Sheets