In the fast-paced world of fashion retail, tracking the right metrics is essential to ensure your store performs efficiently, meets sales targets, and stays competitive. A Fashion Retail KPI Dashboard in Google Sheets allows store managers, analysts, and decision-makers to monitor critical key performance indicators (KPIs) easily. This ready-to-use Google Sheets dashboard simplifies the process of analyzing data, comparing monthly and yearly performance, and making data-driven decisions.
In this article, we will explain the features, benefits, and best practices of using this Fashion Retail KPI Dashboard in Google Sheets. By the end, you’ll know exactly how to leverage it for your store’s success.
What is a Fashion Retail KPI Dashboard in Google Sheets?
Click to Buy Fashion Retail KPI Dashboard in Google Sheets
A Fashion Retail KPI Dashboard in Google Sheets is a structured and interactive template designed to track, measure, and visualize performance metrics of a fashion retail store. The dashboard integrates multiple data sources, including monthly sales, target achievements, and year-to-date (YTD) performance, to provide a complete overview of the store’s operations.
Key features include:
-
Tracking both MTD (Month-to-Date) and YTD (Year-to-Date) performance
-
Comparing actual numbers with targets and previous year results
-
Monitoring KPIs using conditional formatting, including up/down arrows for quick visual insights
-
Easy customization using dropdowns and interactive sheets
This dashboard empowers managers to focus on critical KPIs, improve decision-making, and optimize retail operations.
Key Features of the Fashion Retail KPI Dashboard in Google Sheets
This dashboard contains six worksheets, each serving a specific purpose:
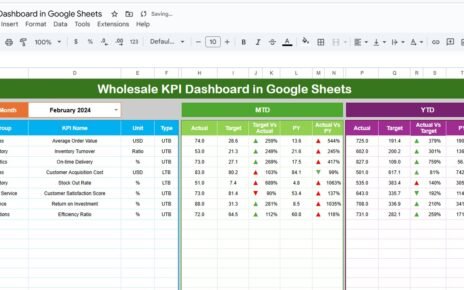
1. Dashboard Sheet Tab
The Dashboard Sheet is the main page, providing an overview of all KPIs.
Key features include:
-
Month Selection Dropdown (Range D3): Automatically updates all dashboard numbers for the selected month
-
MTD Metrics: Displays Actual, Target, Previous Year data with Target vs Actual and PY vs Actual comparisons
-
YTD Metrics: Displays cumulative performance data with similar comparisons
-
Conditional Formatting: Green and red arrows indicate whether KPIs are on track or falling behind

Click to Buy Fashion Retail KPI Dashboard in Google Sheets
2. KPI Trend Sheet Tab
The KPI Trend Sheet provides detailed analysis of individual KPIs.
Key features include:
-
KPI Name selection from dropdown (Range C3)
-
Displays KPI Group, Unit, and Type (Lower-the-Better or Upper-the-Better)
-
Formula and KPI definition for easy reference
-
Visual trend charts to track KPI performance over time

3. Actual Number Sheet Tab
The Actual Number Sheet is where you enter actual MTD and YTD values for each KPI.
Instructions:
-
Update numbers based on the month selected in Range E1
-
Ensure accuracy for correct dashboard calculation

Click to Buy Fashion Retail KPI Dashboard in Google Sheets
4. Target Sheet Tab
The Target Sheet captures KPI targets for the corresponding month.
Instructions:
-
Fill in MTD and YTD targets for each KPI
-
Use accurate targets to compare actual performance

5. Previous Year Number Sheet Tab
The Previous Year Sheet stores last year’s numbers for comparison purposes.
Instructions:
-
Fill in values similar to the current year
-
Enables percentage comparison to measure growth

Click to Buy Fashion Retail KPI Dashboard in Google Sheets
6. KPI Definition Sheet Tab
The KPI Definition Sheet lists detailed KPI information.
Fields included:
-
KPI Name
-
KPI Group
-
Unit
-
Formula
-
KPI Definition
-
KPI Type (Lower-the-Better or Upper-the-Better)
This sheet ensures clarity and consistency when monitoring KPIs across the dashboard.

Advantages of the Fashion Retail KPI Dashboard
Click to Buy Fashion Retail KPI Dashboard in Google Sheets
Using a Google Sheets dashboard for retail KPIs offers several advantages:
-
Centralized Data: Combines all relevant KPI metrics in one place
-
Real-Time Analysis: Updates automatically when new numbers are entered
-
Visual Insights: Conditional formatting and charts make performance trends easy to interpret
-
Customizable: Add or remove KPIs based on store needs
-
Improved Decision-Making: Enables managers to identify underperforming areas quickly
-
Time-Saving: Reduces the need for manual calculations and reports
Best Practices for Using the Dashboard
To maximize the effectiveness of your Fashion Retail KPI Dashboard, follow these best practices:
-
Update Data Regularly: Ensure MTD and YTD values are current for accurate insights
-
Verify Data Accuracy: Double-check inputs to prevent misleading trends
-
Focus on Critical KPIs: Prioritize metrics that directly impact store profitability
-
Analyze Trends, Not Just Numbers: Look at historical data to identify patterns
-
Use Conditional Formatting Wisely: Make sure colors and arrows are intuitive
-
Document Changes: Keep a log of updates for transparency and accountability
-
Customize for Your Store: Adapt KPI groups and metrics to fit your business model
Examples of KPIs in Fashion Retail
Click to Buy Fashion Retail KPI Dashboard in Google Sheets
Some important KPIs included in this dashboard might include:
-
Total Sales Revenue (Upper-the-Better)
-
Average Transaction Value (Upper-the-Better)
-
Customer Footfall (Upper-the-Better)
-
Stock Turnover Rate (Upper-the-Better)
-
Return Rate (Lower-the-Better)
-
Gross Margin % (Upper-the-Better)
-
Sales per Employee (Upper-the-Better)
These KPIs help store managers monitor profitability, customer engagement, and operational efficiency.
Why Choose Google Sheets for KPI Dashboards?
Click to Buy Fashion Retail KPI Dashboard in Google Sheets
Google Sheets provides several benefits for KPI tracking:
-
Cloud-Based: Access your dashboard from anywhere, anytime
-
Collaborative: Multiple users can update data simultaneously
-
Flexible: Easily customize KPIs, charts, and formulas
-
Cost-Effective: No expensive software required
-
Easy Integration: Import data from POS systems, CRM, and Excel
Using Google Sheets ensures that your dashboard is accessible and flexible, without the limitations of desktop-only tools.
Conclusion
A Fashion Retail KPI Dashboard in Google Sheets empowers retail managers and analysts to monitor, analyze, and optimize store performance. With interactive dashboards, real-time MTD and YTD metrics, and comprehensive KPI definitions, you can quickly identify trends, improve efficiency, and achieve business targets.
By following best practices and updating data regularly, your dashboard becomes an essential tool for making informed, data-driven decisions in fashion retail.
Frequently Asked Questions (FAQs)
Click to Buy Fashion Retail KPI Dashboard in Google Sheets
Q1: Can I add new KPIs to the dashboard?
Yes, you can add new KPIs by updating the KPI Definition Sheet and inputting data in the respective sheets.
Q2: Is this dashboard suitable for multiple stores?
Yes, you can customize it to include multiple stores by adding a “Store Name” column in the Actual, Target, and Previous Year sheets.
Q3: Can I track both online and offline sales?
Absolutely! Add separate KPIs for online and offline sales and visualize them using existing charts.
Q4: Does it automatically update trends?
Yes, trends in the KPI Trend Sheet update automatically when you enter new data.
Q5: Can I share this dashboard with my team?
Yes, Google Sheets is cloud-based, so you can share it with your team and control editing permissions.
Q6: What do Upper-the-Better (UTB) and Lower-the-Better (LTB) mean?
UTB KPIs improve when numbers increase (e.g., sales revenue). LTB KPIs improve when numbers decrease (e.g., return rate).
Visit our YouTube channel to learn step-by-step video tutorials
Youtube.com/@NeotechNavigators
Watch the step-by-step video Demo: