Effective financial management is critical for any organization. The Financial Summary Dashboard in Google Sheets provides a ready-to-use solution for tracking revenue, expenses, and profit in one centralized tool. With interactive charts and cards, this dashboard allows finance teams, managers, and executives to analyze financial performance and make data-driven decisions efficiently.
In this article, we will explain the features, benefits, and best practices for using this financial dashboard.
What Is a Financial Summary Dashboard?
A Financial Summary Dashboard is a visual tool that consolidates financial metrics into a single view. Using Google Sheets, it enables organizations to track monthly and yearly financial performance, monitor departmental budgets, and analyze revenue and expense trends.
The dashboard helps users:
-
Monitor revenue, expenses, and profit in real-time
-
Compare actuals with targets and previous year data
-
Visualize financial trends by category, department, and responsible person
-
Identify cost-saving opportunities and optimize budgets
Key Features of the Financial Summary Dashboard
Click to Buy Financial Summary Dashboard in Google Sheets
This dashboard contains several worksheets to provide a comprehensive view of your financial data:
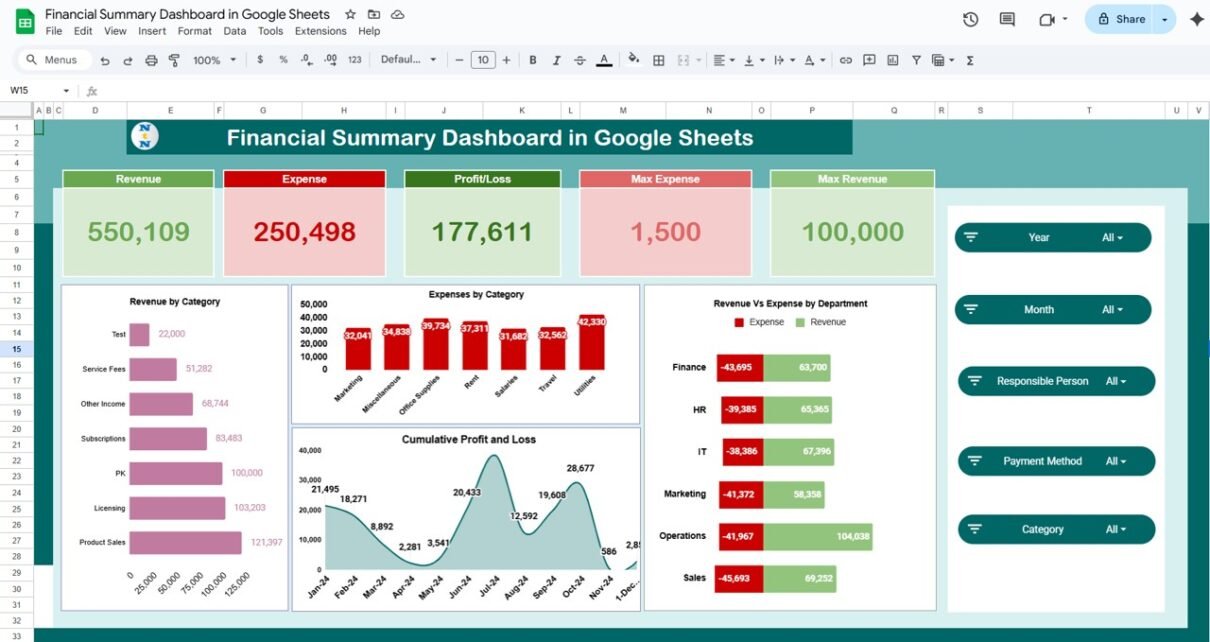
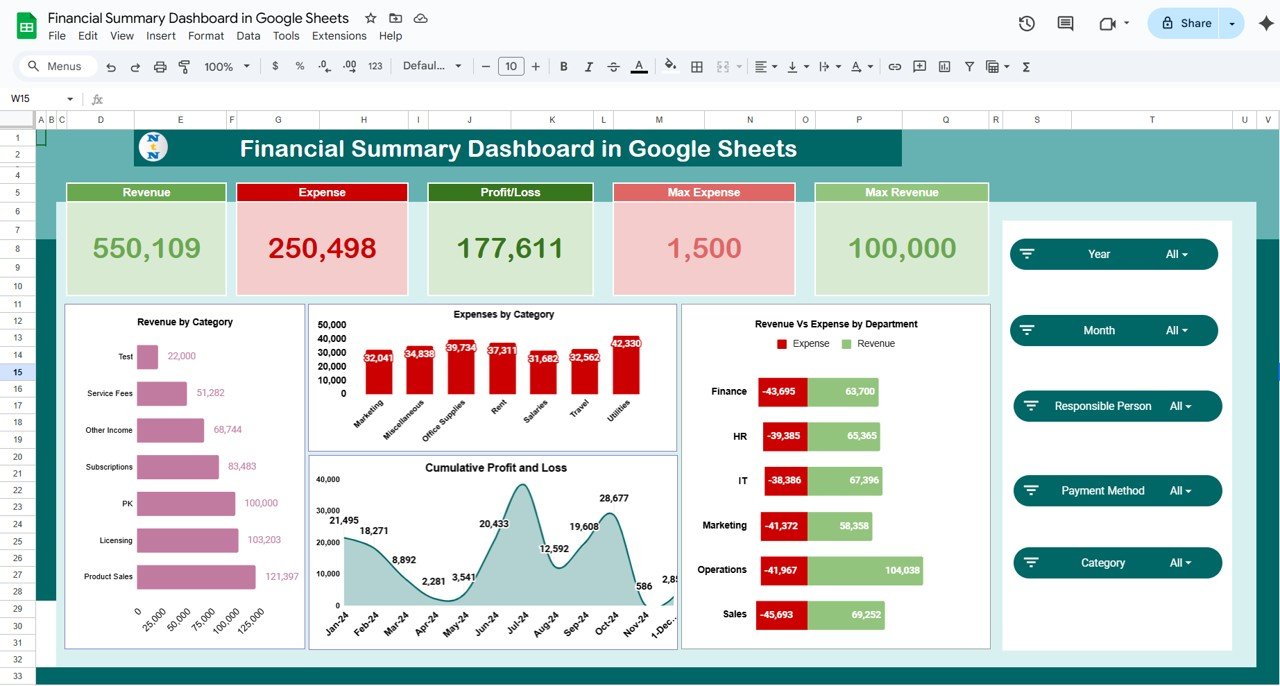
1. Overview Sheet
The Overview sheet gives a high-level snapshot of key financial metrics:
Cards:
-
Revenue: Total revenue generated
-
Expense: Total expenses incurred
-
Profit-Loss: Net profit or loss
-
Max Revenue: Highest revenue recorded
-
Max Expense: Highest expense recorded
Charts:
-
Revenue by Category: Visualize revenue streams
-
Expenses by Category: See how costs are distributed
-
Revenue vs Expense by Department: Compare financial performance across departments
-
Cumulative Profit and Loss: Track net profit over time
Click to Buy Financial Summary Dashboard in Google Sheets
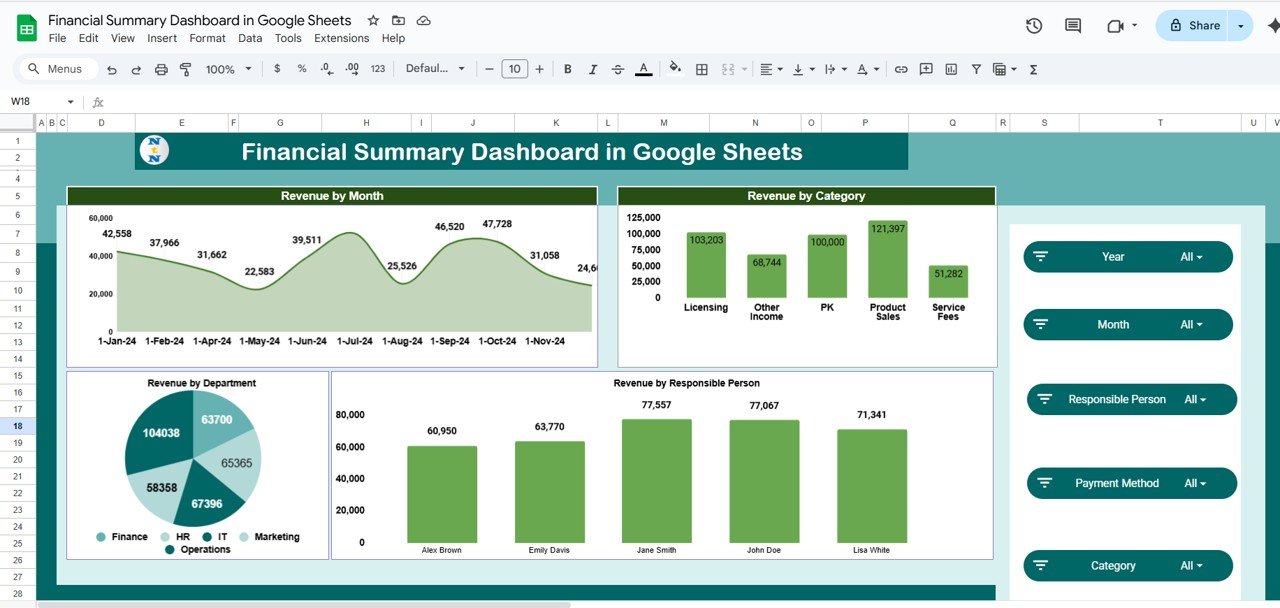
2. Revenue Sheet
The Revenue sheet provides detailed analysis of revenue metrics:
Charts:
-
Revenue by Month: Track revenue trends over the year
-
Revenue by Category: Identify top-performing product or service categories
-
Revenue by Responsible Person: Evaluate contributions by team members
-
Revenue by Department: Compare revenue across departments
Click to Buy Financial Summary Dashboard in Google Sheets
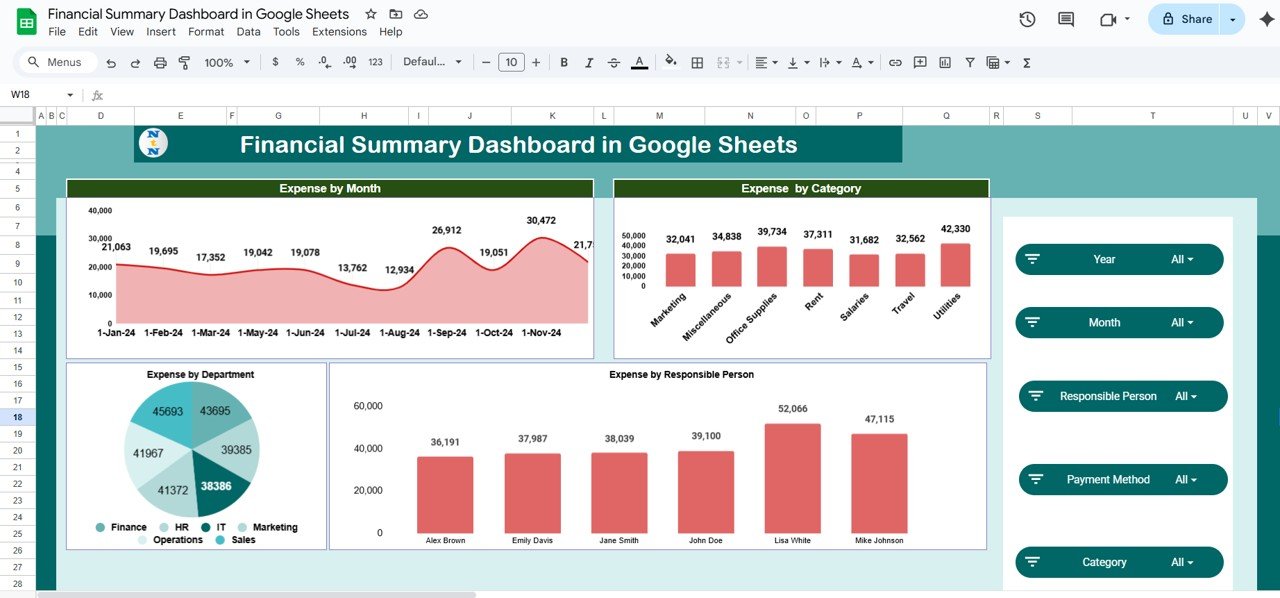
3. Expense Sheet
The Expense sheet provides a breakdown of expenditures:
Charts:
-
Expense by Month: Monitor expense trends and peaks
-
Expense by Category: Identify major cost centers
-
Expense by Responsible Person: Track individual or team-related spending
-
Expense by Department: Compare departmental expenses
Click to Buy Financial Summary Dashboard in Google Sheets
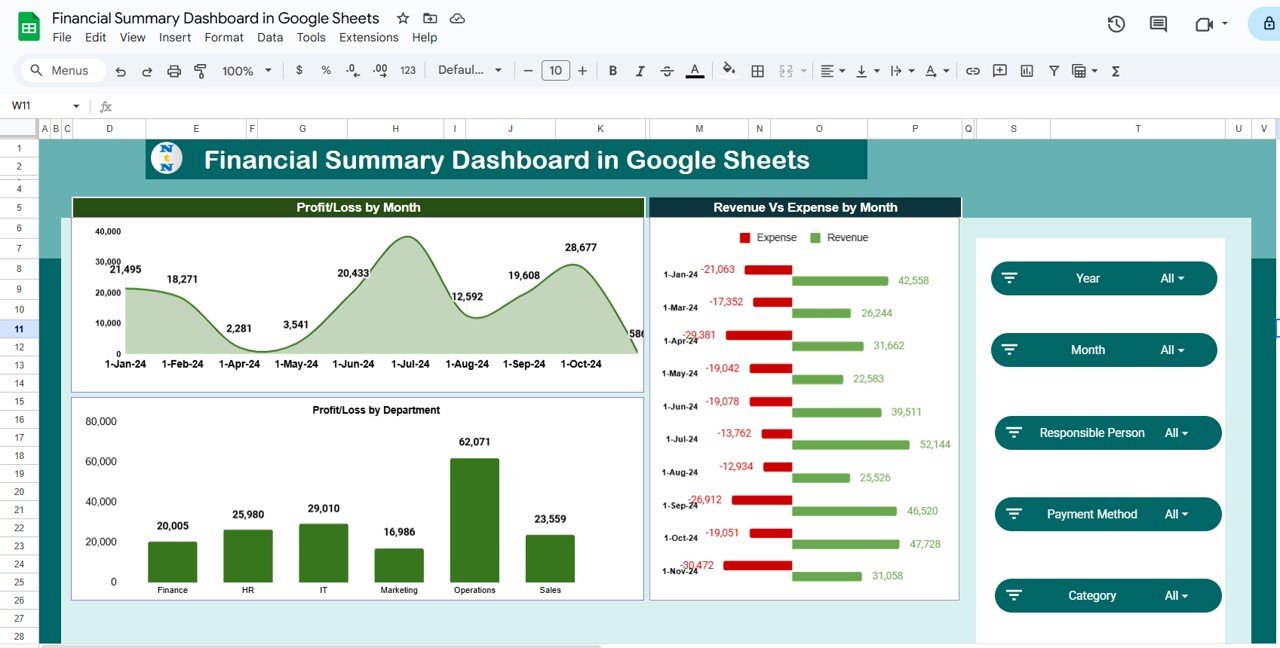
4. Profit-Loss Sheet
The Profit-Loss sheet helps analyze net performance:
Charts:
-
Profit/Loss by Month: Monitor monthly profitability
-
Revenue vs Expense by Month: Compare income and costs
-
Profit/Loss by Department: Identify which departments are most profitable
Click to Buy Financial Summary Dashboard in Google Sheets
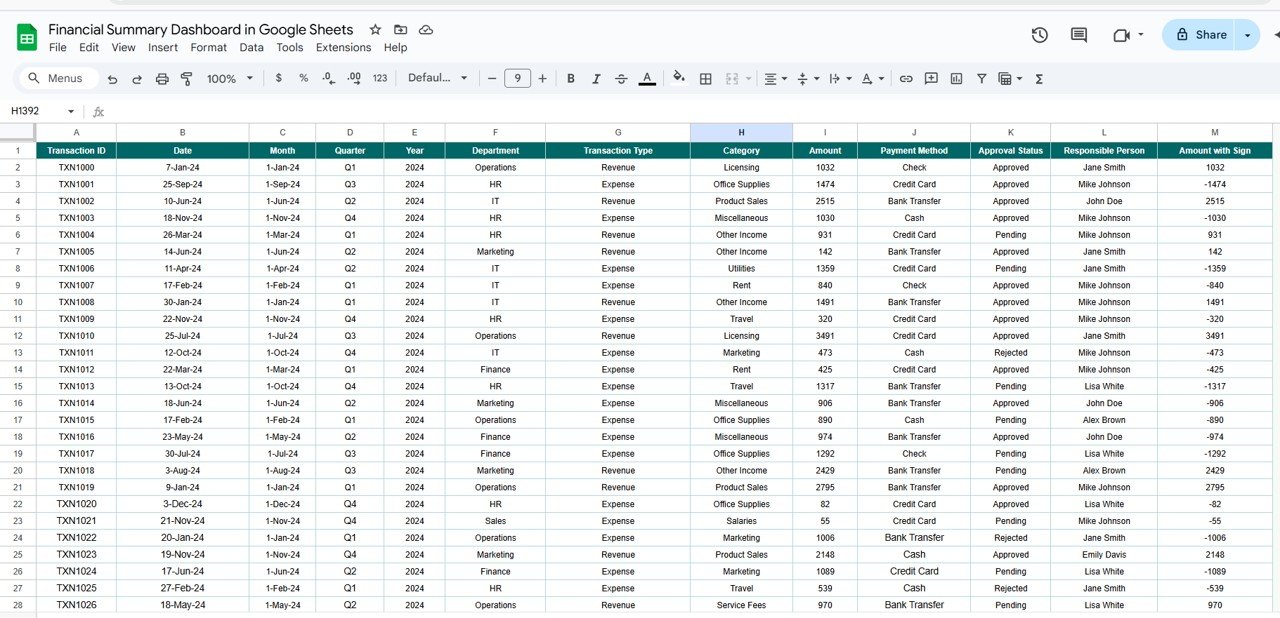
5. Data Sheet Tab
The Data sheet is where you input all financial data:
-
Revenue, expense, profit figures
-
Categories, responsible persons, departments, and dates
-
Updates to this sheet automatically reflect in all dashboards and charts
This structured data ensures accuracy and allows for dynamic analysis.
Click to Buy Financial Summary Dashboard in Google Sheets
Advantages of Using the Financial Summary Dashboard
-
Centralized Financial View: All revenue, expense, and profit data in one sheet
-
Real-Time Insights: Updates automatically when new data is entered
-
Visual Analysis: Cards and charts make trends and patterns easy to interpret
-
Departmental Comparisons: Identify top-performing departments and cost centers
-
Budget Optimization: Highlight areas for cost reduction or increased investment
-
Time-Saving: Reduces manual calculation and reporting
Best Practices for Using the Dashboard
-
Update Data Regularly: Input financial transactions promptly to maintain accuracy
-
Segment by Department and Category: Understand where revenue is coming from and where costs are highest
-
Monitor Trends Over Time: Track monthly and cumulative performance for strategic planning
-
Use Conditional Formatting: Highlight anomalies or performance gaps
-
Set Financial Targets: Compare actuals with budgets to monitor performance against goals
-
Review Insights with Teams: Share dashboard insights to align finance and operational strategies
How This Dashboard Helps Organizations
Click to Buy Financial Summary Dashboard in Google Sheets
-
Monitor Financial Health: Track revenue, expenses, and profit in one view
-
Optimize Resource Allocation: Identify areas for investment or cost-cutting
-
Improve Decision-Making: Use visual trends to make informed financial decisions
-
Enhance Accountability: Assign responsibility for revenue and expenses by person or department
-
Support Strategic Planning: Use historical and real-time data to forecast future performance
Frequently Asked Questions (FAQs)
Q1: Can I customize the dashboard for my organization’s categories?
Yes, you can modify revenue and expense categories, departments, and responsible persons to fit your business needs.
Q2: How often should I update the data?
For accurate insights, update the Data sheet monthly, weekly, or after major transactions.
Q3: Can I compare revenue and expenses year-over-year?
Yes, you can add previous year data to analyze trends and growth.
Q4: Is this dashboard suitable for multiple departments?
Absolutely. You can track revenue, expenses, and profit for each department separately.
Q5: Can I use this dashboard to forecast future profits?
Yes, by analyzing trends and cumulative data, you can estimate potential profits and losses.
Conclusion
Click to Buy Financial Summary Dashboard in Google Sheets
The Financial Summary Dashboard in Google Sheets is a powerful, ready-to-use tool for tracking, analyzing, and optimizing your organization’s finances. With real-time insights, visual charts, and dynamic data input, finance teams can make informed decisions, improve profitability, and streamline financial reporting.
Visit our YouTube channel to learn step-by-step video tutorials
Youtube.com/@NeotechNavigators