The food service industry depends on speed, quality, cost control, and customer satisfaction. Restaurants, cafeterias, catering services, and food chains must track performance daily to stay profitable. However, many food service teams still rely on manual registers, basic spreadsheets, or delayed reports. As a result, performance gaps remain hidden and corrective actions arrive too late.
That is exactly where a Food Service KPI Scorecard in Google Sheets adds real value.
In this detailed article, you will learn what a Food Service KPI Scorecard in Google Sheets is, how it works, its worksheet-wise structure, key KPIs, advantages, best practices, and frequently asked questions. By the end, you will clearly understand how this ready-to-use scorecard helps food service teams monitor performance and make better decisions.
What Is a Food Service KPI Scorecard in Google Sheets?
Click to Buy Food Service KPI Scorecard in Google Sheets
A Food Service KPI Scorecard in Google Sheets is a ready-to-use performance monitoring template designed to track key food service KPIs related to sales, cost, efficiency, quality, and customer experience.
Instead of reviewing long reports or raw numbers, this scorecard presents KPIs in a visual and easy-to-understand format using:
-
Traffic light indicators (Red, Amber, Green)
-
Up and down arrows for percentage change
-
Monthly (MTD) and Yearly (YTD) views
Moreover, because it runs on Google Sheets, teams can access and update performance data in real time.
As a result, food service managers gain instant clarity on operational performance.
Why Is a Food Service KPI Scorecard Important?
Food service operations run on thin margins. Therefore, tracking KPIs accurately becomes essential.
Here is why a Food Service KPI Scorecard matters:
- It provides a clear monthly and yearly performance snapshot
- It highlights underperforming KPIs instantly
- It compares actual performance with targets visually
- It improves accountability across kitchen and service teams
- It reduces manual reporting effort
Because Google Sheets is cloud-based, everyone works with the same updated data.
How Does the Food Service KPI Scorecard in Google Sheets Work?
Click to Buy Food Service KPI Scorecard in Google Sheets
This scorecard works by combining structured KPI definitions, data input, and automated calculations.
First, users define KPIs and their logic.
Then, they enter monthly or yearly data in the input sheet.
After that, the scorecard automatically updates:
-
KPI values
-
Traffic light colors
-
Trend arrows and percentage change
Finally, users switch between MTD and YTD views with a single click.
Because of this setup, users focus on insights instead of formulas.
What KPIs Are Included in the Food Service KPI Scorecard?
Click to Buy Food Service KPI Scorecard in Google Sheets
This scorecard tracks 10 essential food service KPIs that reflect both operational and financial performance.
Common Food Service KPIs Used
-
Daily Sales Revenue
-
Food Cost Percentage
-
Average Order Value
-
Order Fulfillment Time
-
Customer Satisfaction Score
-
Order Accuracy Rate
-
Food Wastage Percentage
-
Table Turnover Rate
-
Labor Cost Percentage
-
Staff Productivity
Each KPI includes:
-
Unit of measurement
-
Formula logic
-
Performance direction (Lower the Better / Upper the Better)
What Worksheets Are Included in the Food Service KPI Scorecard?
Click to Buy Food Service KPI Scorecard in Google Sheets
The Food Service KPI Scorecard in Google Sheets includes multiple well-structured worksheets, each serving a clear purpose.
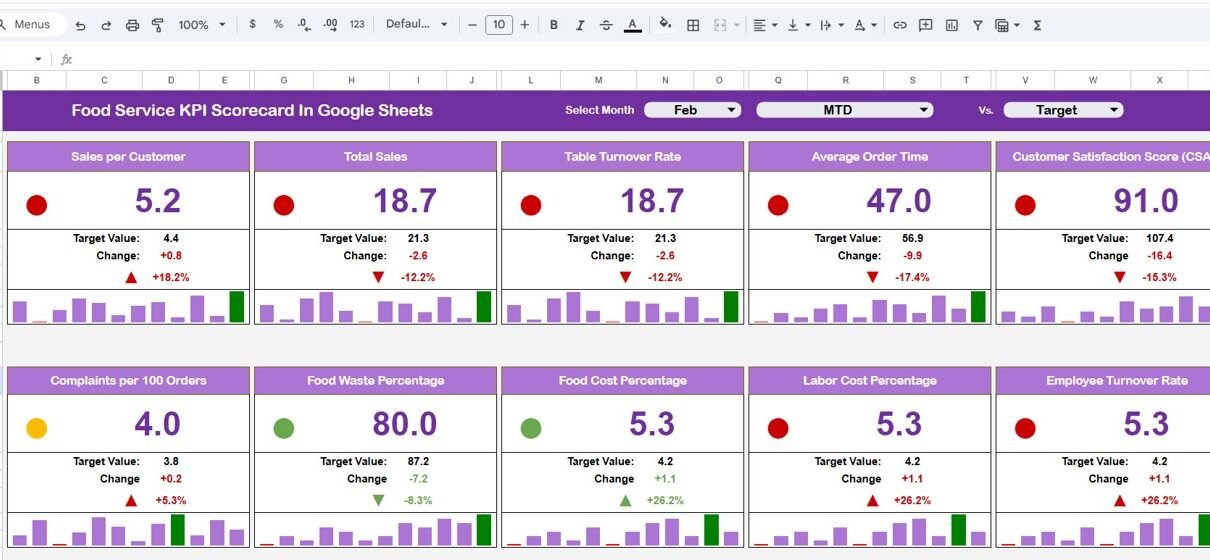
Main Scorecard Sheet
The Scorecard Sheet is the primary dashboard.
Key Features of the Scorecard Sheet
-
Month dropdown at the top
-
Monthly KPI scorecard view
-
Automatic update of all KPI values
-
Traffic light indicators (Red, Amber, Green)
-
Up and down arrows showing percentage change
-
Toggle between MTD and YTD views
Because everything updates automatically, managers can review performance in seconds.

Click to Buy Food Service KPI Scorecard in Google Sheets
Trend Sheet Tab
The Trend Sheet Tab focuses on KPI-level analysis.
Key Features of the Trend Sheet
-
KPI selector dropdown on cell C3
-
Displays KPI Group
-
Shows KPI Unit
-
Indicates KPI Type (Lower the Better / Upper the Better)
-
Displays KPI Formula
-
Shows KPI Definition
This sheet helps users understand KPI behavior and trends clearly.

Click to Buy Food Service KPI Scorecard in Google Sheets
KPI Definition Sheet Tab
The KPI Definition Sheet Tab acts as the foundation of the scorecard.
Fields Included
-
KPI Name
-
KPI Group
-
Unit
-
Formula (aggregation logic)
-
KPI Definition
-
KPI Type (LTB / UTB)
Because clarity matters, this sheet ensures consistent KPI understanding across teams.

Click to Buy Food Service KPI Scorecard in Google Sheets
Data Input Sheet Tab
The Data Input Sheet Tab captures raw performance data.
Key Features
-
Structured input layout
-
Monthly data entry
-
Yearly data entry
-
KPI-wise values
Users only input numbers, while calculations and visuals update automatically.

Click to Buy Food Service KPI Scorecard in Google Sheets
Colour Settings
The Colour Settings section controls all visual indicators.
Key Features
-
Traffic light thresholds
-
Color rules for KPI performance
-
Arrow color logic for trend direction
This setup ensures visual consistency and quick interpretation.’

Click to Buy Food Service KPI Scorecard in Google Sheets
Advantages of Food Service KPI Scorecard in Google Sheets
Using this scorecard delivers strong operational benefits.
Key Advantages
-
Instant Performance Visibility
-
Clear Monthly and Yearly Comparison
-
Visual Performance Indicators
-
Easy Customization
-
Real-Time Collaboration
-
No Expensive BI Tools Required
Because of these advantages, food service teams manage performance more effectively.
Who Should Use a Food Service KPI Scorecard?
Click to Buy Food Service KPI Scorecard in Google Sheets
This scorecard fits multiple food service roles.
Ideal Users
-
Restaurant owners
-
Food service managers
-
Catering service operators
-
QSR and cloud kitchen teams
-
Operations and finance teams
If your role involves food service performance tracking, this scorecard fits perfectly.
Best Practices for the Food Service KPI Scorecard in Google Sheets
Follow these best practices to get maximum value.
1. Keep KPI Definitions Clear
Always maintain accurate formulas and definitions.
2. Update Data Regularly
Daily or monthly updates ensure reliable insights.
3. Review Traffic Lights Frequently
Focus on red and amber KPIs first.
4. Protect Formula Cells
Lock calculations to avoid accidental edits.
5. Align KPIs with Business Goals
Track KPIs that directly impact cost, speed, and customer satisfaction.
Conclusion
A Food Service KPI Scorecard in Google Sheets is a powerful and practical solution for tracking food service performance. It combines KPI definitions, data input, trend analysis, and visual indicators into one ready-to-use template.
Moreover, its traffic lights, trend arrows, and month-based selection help managers monitor performance quickly and take timely actions. By using this scorecard, food service businesses improve efficiency, reduce waste, and deliver better customer experiences consistently.
Frequently Asked Questions (FAQs)
Click to Buy Food Service KPI Scorecard in Google Sheets
What is a Food Service KPI Scorecard in Google Sheets?
It is a ready-to-use scorecard that tracks food service KPIs using visual indicators in Google Sheets.
Can I switch between monthly and yearly views?
Yes, you can view monthly data using MTD and yearly data using YTD.
Does the scorecard update automatically?
Yes, selecting a different month updates all KPIs and visuals automatically.
Can I customize KPIs in this scorecard?
Yes, you can add or modify KPIs using the KPI Definition sheet.
Is this suitable for restaurants and catering services?
Yes, it works perfectly for restaurants, cafeterias, catering services, and food chains.
Does it require advanced Google Sheets skills?
No, it is designed for easy use with structured inputs.
Visit our YouTube channel to learn step-by-step video tutorials
Youtube.com/@NeotechNavigators
Watch the step-by-step video tutorial: