An arcade is one of the hardest small businesses to keep honest books on. Money arrives as cash at the counter, as a prepaid card top-up, as a party advance paid three weeks early, as a tournament entry fee and as a soft drink – and it leaves as electricity, machine lease, prize stock and a claw machine that swallowed a coin. The Gaming Zone & Arcade Management System Web App is an arcade management system built to put all of that on one screen, and this walkthrough goes through every screen of the shipped build, including the bits that are less flattering.
Get the Gaming Zone & Arcade Management System
Try the Live Demo
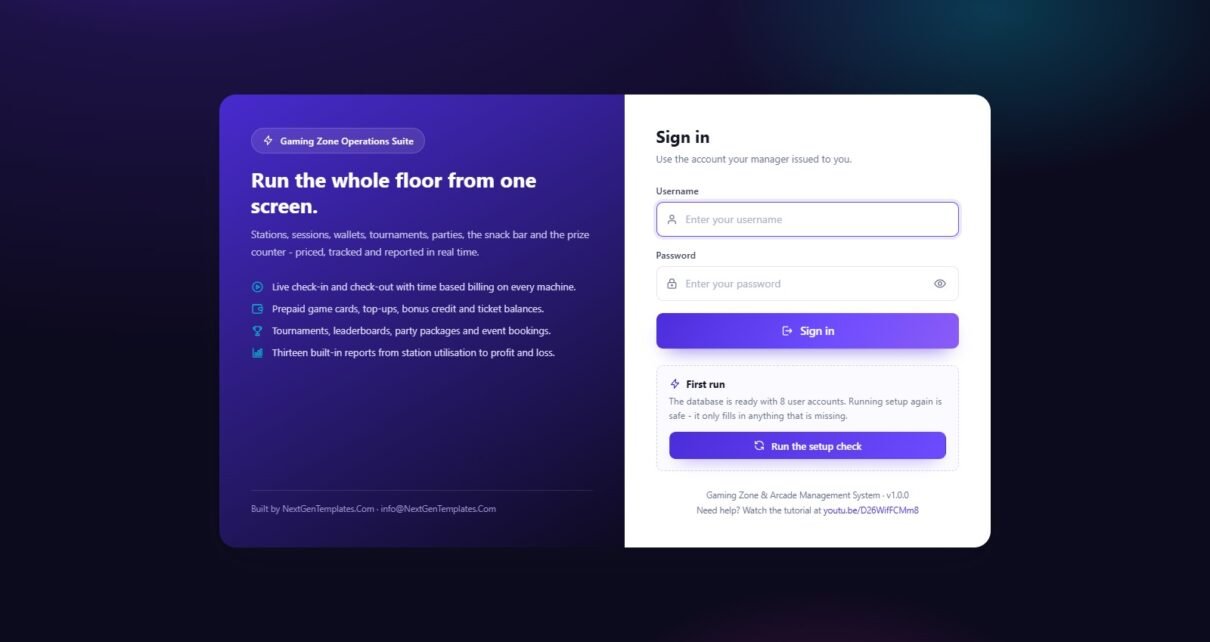
This is a real deployment of the same build, seeded with the demonstration dataset. Sign in with any of the accounts below.
Demo sign-in details – all eight seeded accounts
| Role | Username | Password | Reaches |
|---|---|---|---|
| Administrator | admin |
Arcade@2024 |
Everything, incl. Users, Settings, Audit log, Database archive |
| Manager | manager |
Manager@2024 |
All operations, all reports, expenses, staff, lists |
| Floor Supervisor | supervisor |
Floor@2024 |
Floor, events, roster, maintenance, read-only reports |
| Floor Supervisor | floor2 |
Shift@2024 |
Second supervisor account |
| Cashier | cashier |
Cashier@2024 |
Check in/out, counter, top-ups, redemption, invoices, payments |
| Cashier | cashier2 |
Counter@2024 |
Second counter account |
| Technician | tech |
Tech@2024 |
Stations, games, maintenance and roster only |
| Technician | tech2 |
Service@2024 |
Second technician account |
These logins are public deliberately. The demo is a shared instance with sample data that resets – it is not anybody’s live venue. Your own copy builds a private database in your own Google Drive, and the manual asks you to change all eight passwords on day one.
What the arcade management system dashboard actually tells you
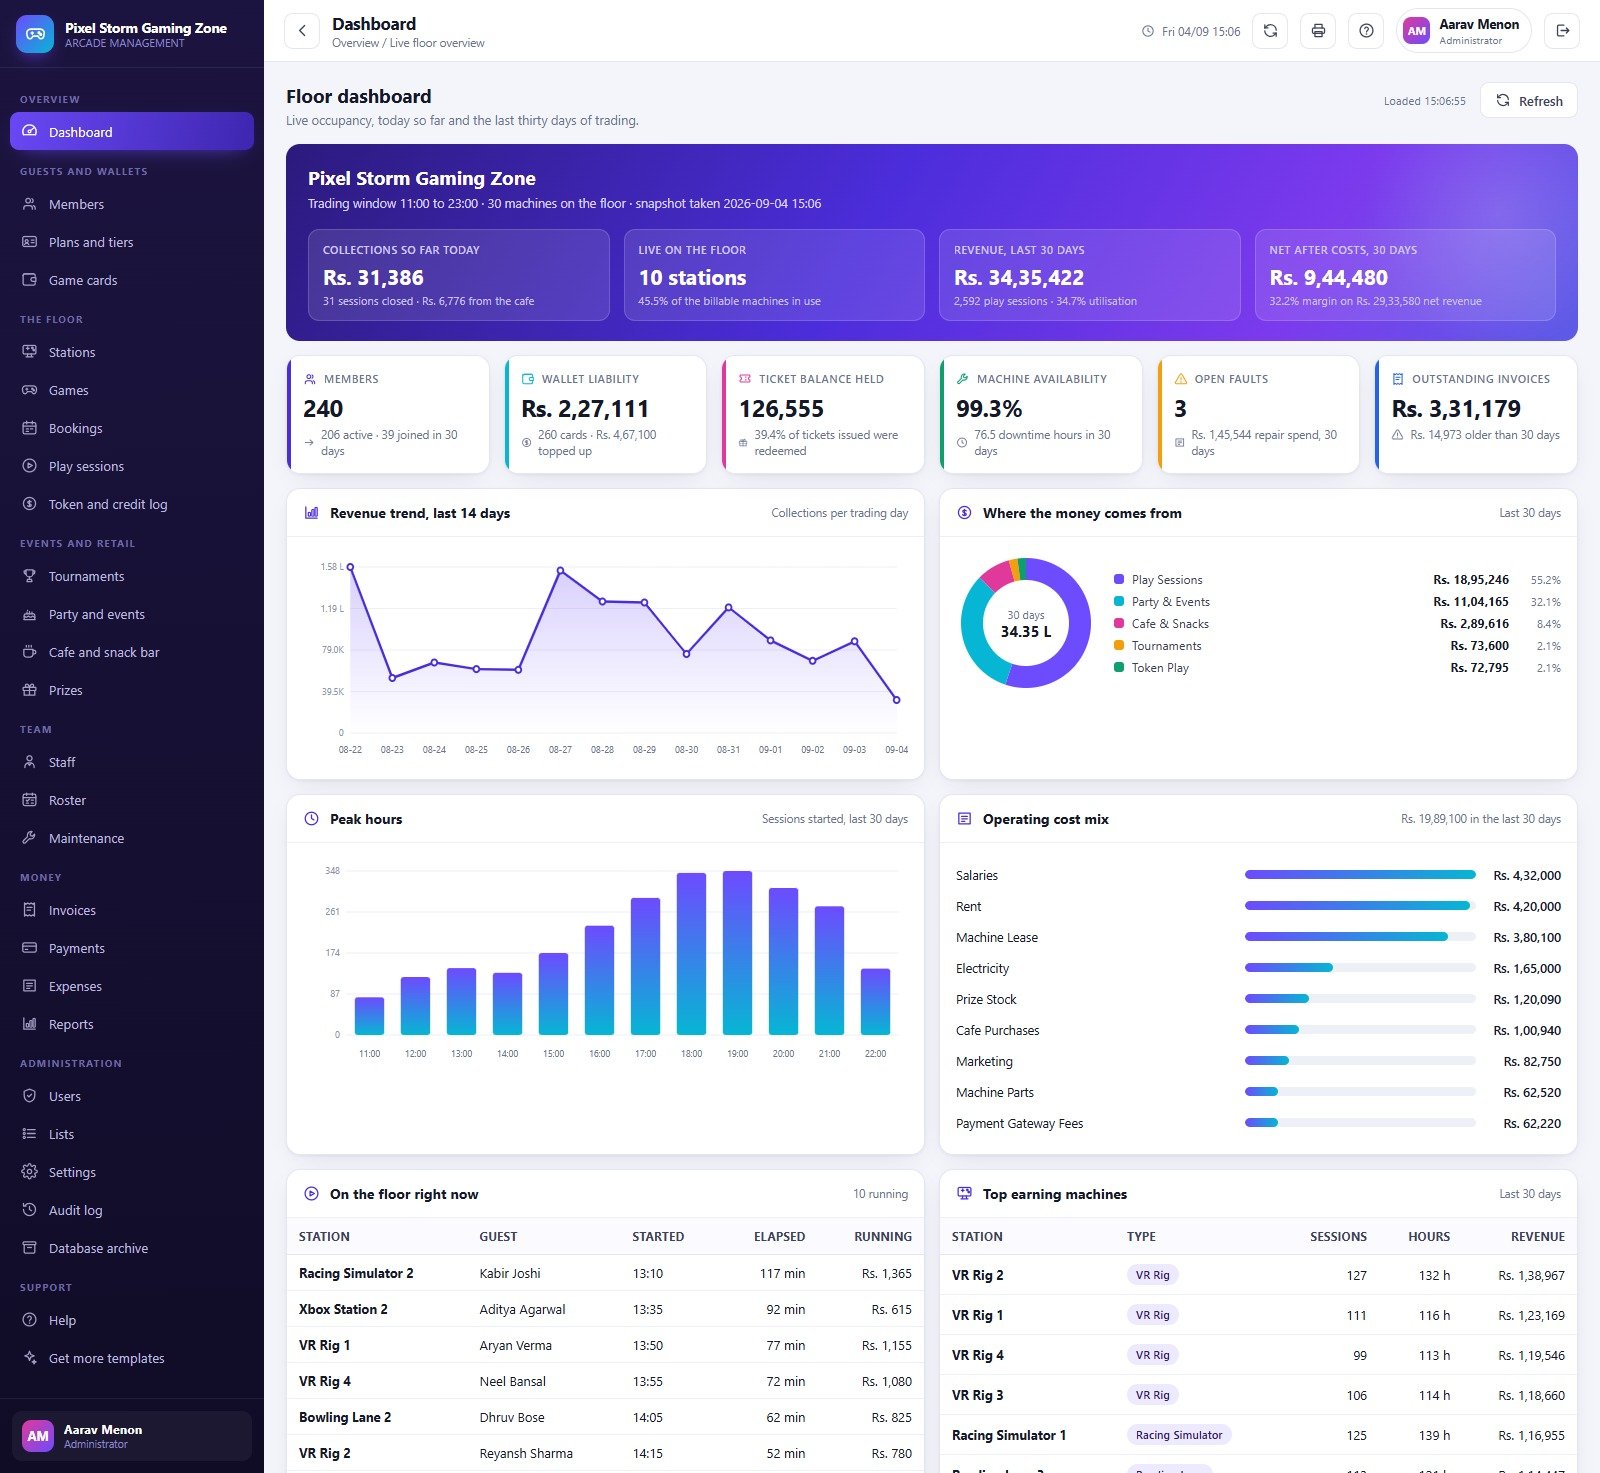
The demo venue is called Pixel Storm Gaming Zone: 30 machines, trading 11:00 to 23:00. The top strip answers the four questions an owner asks on the way in – collections so far today (Rs. 31,386 from 31 closed sessions plus Rs. 6,776 at the cafe), how many machines are running right now (10), thirty-day revenue (Rs. 34,35,422 across 2,592 play sessions at 34.7% utilisation) and what is left after costs (Rs. 9,44,480, a 32.2% margin).
Under that sit six status cards that are easy to ignore and expensive to ignore: 240 members, Rs. 2,27,111 of wallet liability – money already taken for play not yet delivered – 126,555 tickets held against the prize counter, 99.3% machine availability, three open faults and Rs. 3,31,179 outstanding on invoices. Wallet liability and ticket balance are the two numbers arcade spreadsheets almost always miss, and both are on the front page here.
The charts underneath are a fourteen-day revenue trend, a revenue-mix donut (play sessions 55.2%, parties 32.1%, cafe 8.4%, tournaments and token play 2.1% each), a peak-hours histogram that puts the crest squarely at 18:00-19:00, and an operating cost mix that ranks salaries, rent and machine lease as the three biggest lines. Two live tables finish the page: what is on the floor this second, and the top earning machines over thirty days – VR rigs, in this dataset, by a distance.
The floor: stations, sessions and four billing modes
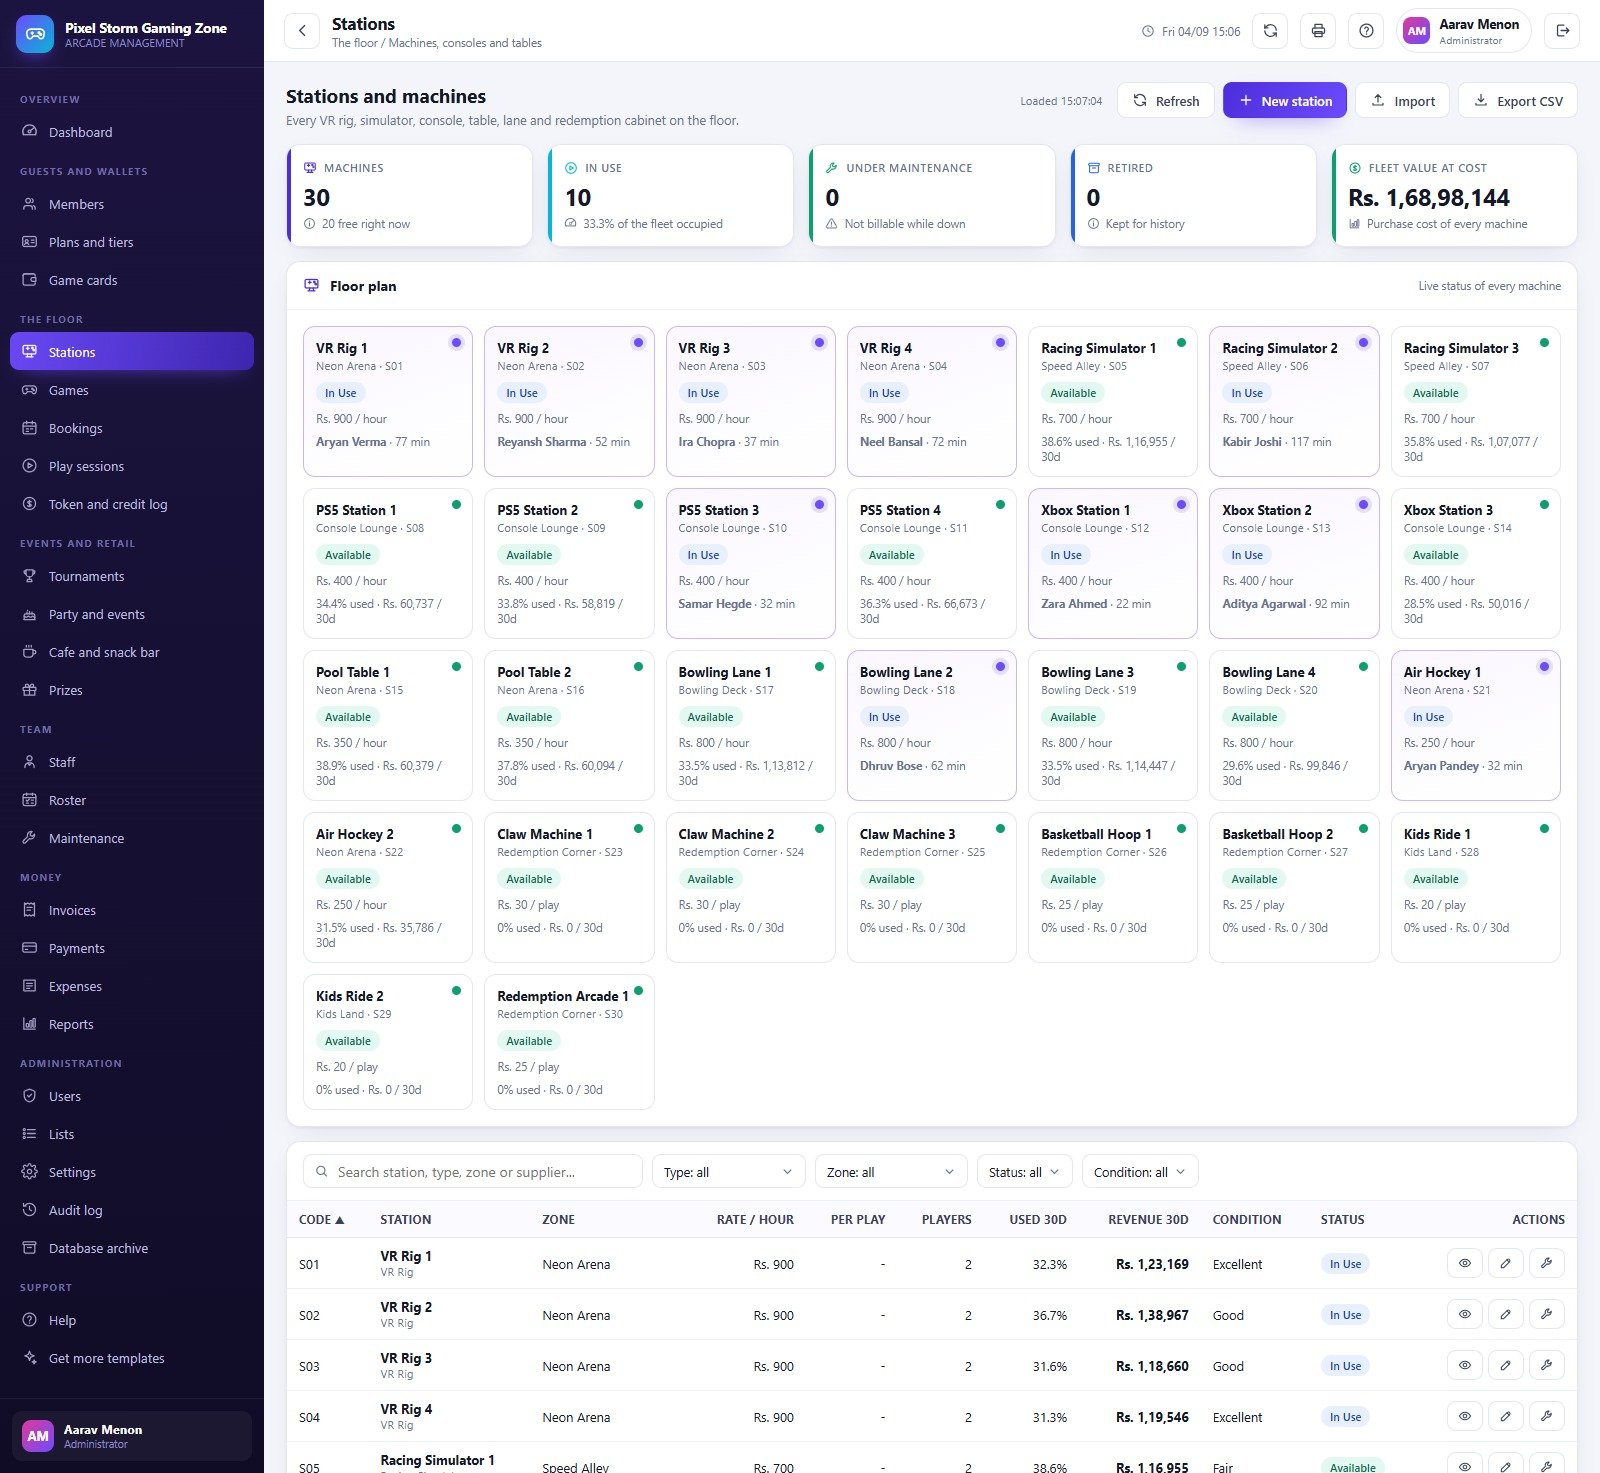
Stations is a tile per machine – VR rigs, racing simulators, PS5 and Xbox stations, pool tables, bowling lanes, air hockey, claw machines, basketball hoops, kids rides and a redemption arcade – each showing zone, status, rate and, if it is running, who is on it and for how long. Hourly machines carry a rate per hour; redemption cabinets carry a rate per play. Thirty-day utilisation and revenue sit on every tile, and a table below adds condition and supplier filters.
Play sessions is the till. Check a guest in, the clock starts, and check-out prices the elapsed minutes, applies the membership discount, adds tax and settles against the wallet. Four billing modes are live in the shipped data – Hourly, Package, Tokens and Membership Free Hours – and because they are dropdown list values rather than hard-coded logic you can rename them to match your own pricing language. Minimum billable minutes (15), grace minutes (5) and the extra-player charge are all settings.
Cards, tickets and the prize counter
This is the part that separates a real arcade management system from a generic booking tool. Game cards holds 260 issued cards with balance, bonus credit, ticket count, issue and expiry dates and a status of Active, Lost or Expired. A top-up credits a configurable bonus percentage automatically – 10% in the demo. Token machines pay tickets onto the card, and the Prizes screen is a proper redemption catalogue: ticket price, cost to you, stock on hand, reorder point and an active flag, with a low-stock warning when items drop below the line. In the demo, 462,067 tickets were issued in thirty days, 182,190 were redeemed across 354 hand-overs, and those prizes cost the business Rs. 85,051.
Bookings, tournaments and parties
Advance bookings carry slot start and end, station, player count, advance held and a source of Walk-in, Phone, Online or Corporate, with a “coming up” panel for the next confirmed slots and a no-show counter that quietly suggests a deposit policy.
Tournaments run in five formats – League, Knockout, Score Attack, Team Relay and Time Attack – with entry fees, prize pools, registration caps and a per-event leaderboard. The demo carries 17 events, 338 entries, Rs. 1,11,100 collected in fees against Rs. 63,700 committed in prizes, which is exactly the ratio a manager needs to see before agreeing to a bigger pot.
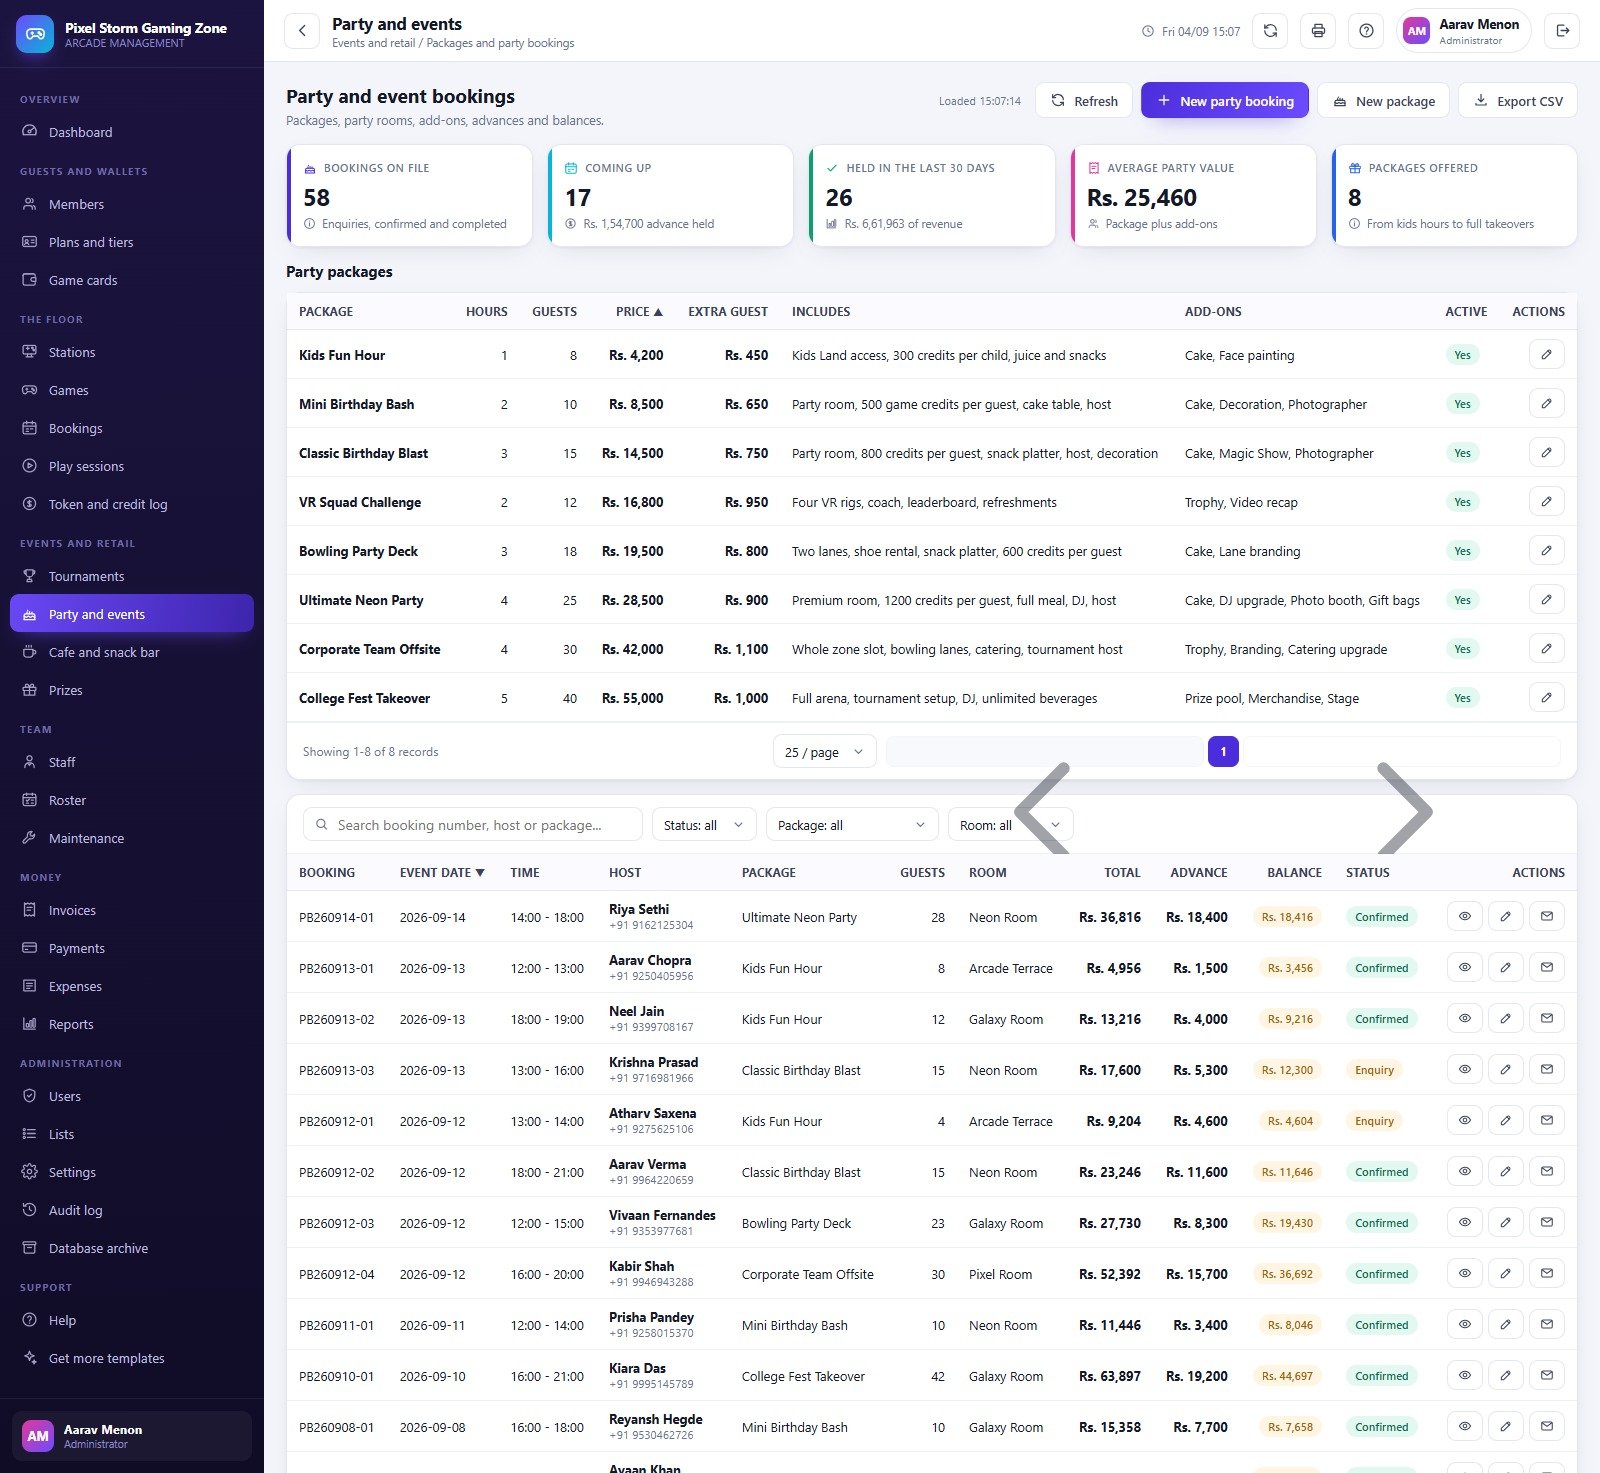
Party and events is eight priced packages from a one-hour Kids Fun Hour at Rs. 4,200 to a five-hour College Fest Takeover at Rs. 55,000, each with included hours, guest count, extra-guest rate, inclusions and add-ons. Bookings track room, total, advance and balance, so the money owed on the day is never a surprise.
Money, people and thirteen reports
Invoices, Payments and Expenses form a small but complete finance layer: 651 invoices with tax, paid and balance; receipts split by mode (Card 32.1%, UPI 29.8%, Cash 23.2%, Bank Transfer 15.0%) and by the staff member who collected them; and an expense voucher register across thirteen categories with payee, mode, reference and approver. An “oldest open invoices” panel is the chase list.
Staff and Roster cover the employee master, scheduled shifts, clock-in and clock-out times, hours worked, overtime and an 88.8% attendance rate. Maintenance logs every fault with technician, hours down, parts, labour and resolution, and ranks the worst-offending machines.
Reports is thirteen of them, each date-filtered, printable and CSV-exportable: Daily Revenue Summary, Cafe Sales, Station Utilisation, Peak Hours Analysis, Top Games and Stations, Prize Redemption, Machine Downtime, Membership Growth, Wallet Liability, Profit and Loss, Outstanding Invoices and Ageing, Tournament Performance, and Staff Attendance and Hours.
Roles in this arcade management system are enforced, not decorative
Eight accounts, five roles and a catalogue of 48 permissions. The same permission map drives the sidebar and the server-side guard, so a Technician who guesses a URL still cannot open Invoices. Every sign-in, create, update, check-in, payment, redemption and export lands in the Audit log with user, role, module and detail – 260 entries in the seeded database. The fastest way to test this is the demo: sign in as tech, then as admin, and compare the sidebars.
Three honest caveats
We open every screenshot before we write, so here are the things worth knowing rather than the things worth selling.
- Two occupancy percentages, two denominators. The dashboard says “10 stations – 45.5% of the billable machines in use”; the Stations page says “10 in use – 33.3% of the fleet occupied”. Both are correct – 10 of 30 machines, or 10 of the 22 hourly-billable ones. Redemption cabinets and per-play machines are not hourly-billable.
- The big registers show the 400 most recent rows. Bookings, the token log and the shift register each say so on their own cards. The reports read the whole table; the on-screen register does not.
- The Daily Revenue Summary chart is shorter than its table. With a thirty-day filter applied the bar chart draws twenty-one bars while the table lists all thirty rows. Totals and the table are complete – only the chart is trimmed.
And a fourth that is not a bug: the Archive register is empty on a fresh install, because a brand-new database has nothing old enough to move.
What it deliberately does not do
It has no connection to your machines – no coin mech, card reader, RFID, IoT or cabinet controller. Sessions are opened and closed by a person; token plays are recorded, not sensed. It has no payment gateway: Card, UPI, Cash and Bank Transfer are payment modes recorded after the fact, nothing is charged, no card details are stored and there is no auto-debit. There is no customer-facing portal or app – guests cannot self-book or check their own ticket balance. And it is not accounting software: the tax percent and label are a printed line on the invoice, not a return. It computes no GST filing, generates no e-invoice or e-way bill and connects to no tax portal. Being an Apps Script web app on a Google Sheets database, Google’s own quotas apply – comfortable for a single busy venue, not a chain-scale SQL platform.
Getting it running
Create a standalone Apps Script project at script.new, paste Code.cs.txt into Code.gs, add an HTML file named exactly Index and paste Index.txt into it. Deploy as a Web app, execute as yourself, access set to Anyone. Run setup once – from the sign-in card’s First run panel or by running setup() in the editor. It builds its own Sheets database with 33 tables, the Drive folder tree and the demonstration dataset; setup is staged and resumable, so a six-minute timeout is not fatal. Then sign in as admin, change all eight passwords, and work through Settings: business profile and tax identifier, currency symbol and tax percent, billable and grace minutes, receipt/invoice/report print sizes (3 inch, 4 inch or A4) and the email notification addresses.
One habit to build early: after any later edit to Code.gs or Index, publish a new version from Manage deployments. Saving the editor does not update the live app.
If your venue is a slightly different shape
We have written up several neighbours on this blog, all built on the same Apps Script architecture, so you can compare screens before choosing:
- Bowling Alley Management System Web App – lanes, shoe hire and league nights rather than free-roaming machines.
- Amusement Park Ticketing Management System Web App – gate admission and ride tickets instead of prepaid wallets.
- Concert & Ticketing Management System Web App – seated events and gate scanning.
- Club & Association Membership Management System Web App – if dues and facilities matter more than machines.
- CrossFit Box Management System Web App – class-based sessions with the same membership plumbing.
Curious how systems like this are put together? The NextGenTemplates Academy learning paths cover the spreadsheet skills behind trackers and management systems, with practice files.
Get the Gaming Zone & Arcade Management System
The verdict on this arcade management system
If you run an arcade, a VR centre, a console lounge or a family entertainment centre and you are currently reconciling three notebooks and a spreadsheet, this is a complete floor system you own outright: 24 screens, 33 tables, 48 permissions and 13 reports, with no server, no hosting bill and no monthly fee. The honest way to judge it is not to read a feature list – it is to open the demo, sign in as a cashier, close a running session and watch the wallet, the tickets and the invoice all move together.
Get the Gaming Zone & Arcade Management System Web App on NextGenTemplates.com – or try the live demo first and decide from the inside.