Managing organizational performance requires monitoring multiple key performance indicators (KPIs) across departments. The General Management KPI Scorecard in Google Sheets is a ready-to-use template designed to track, visualize, and analyze KPI performance efficiently. This scorecard helps managers and executives make data-driven decisions, improve productivity, and achieve business goals.General Management KPI Scorecard in Google Sheets
In this article, we will explore the key features, advantages, best practices, and FAQs of using this KPI scorecard.General Management KPI Scorecard in Google Sheets
What Is a General Management KPI Scorecard in Google Sheets?
A KPI Scorecard consolidates important performance metrics in one interface, allowing organizations to monitor and analyze progress toward strategic objectives. Using Google Sheets, this scorecard provides real-time visibility of actual performance versus targets for both MTD (Month-to-Date) and YTD (Year-to-Date).
The scorecard is ideal for:
-
Executives and managers tracking departmental performance
-
HR, finance, and operations teams monitoring KPIs
-
Organizations seeking a structured approach to performance management
Key Features of the General Management KPI Scorecard in Google Sheets
Click to Buy General Management KPI Scorecard in Google Sheets
This template includes four worksheets, each with a specific purpose:General Management KPI Scorecard in Google Sheets
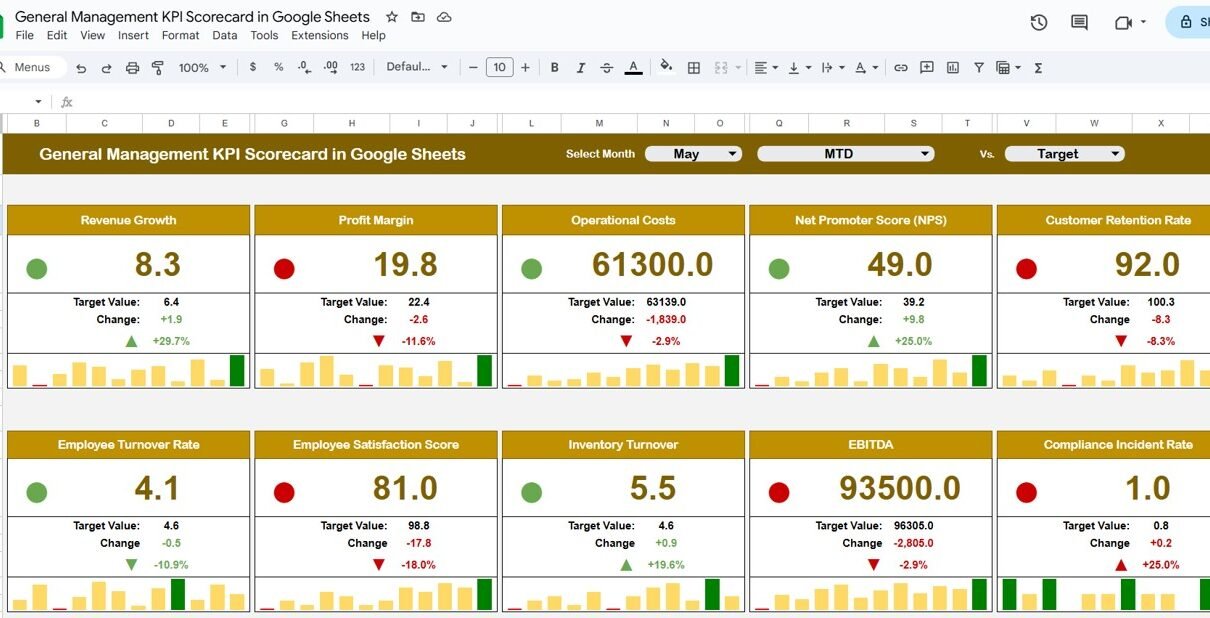
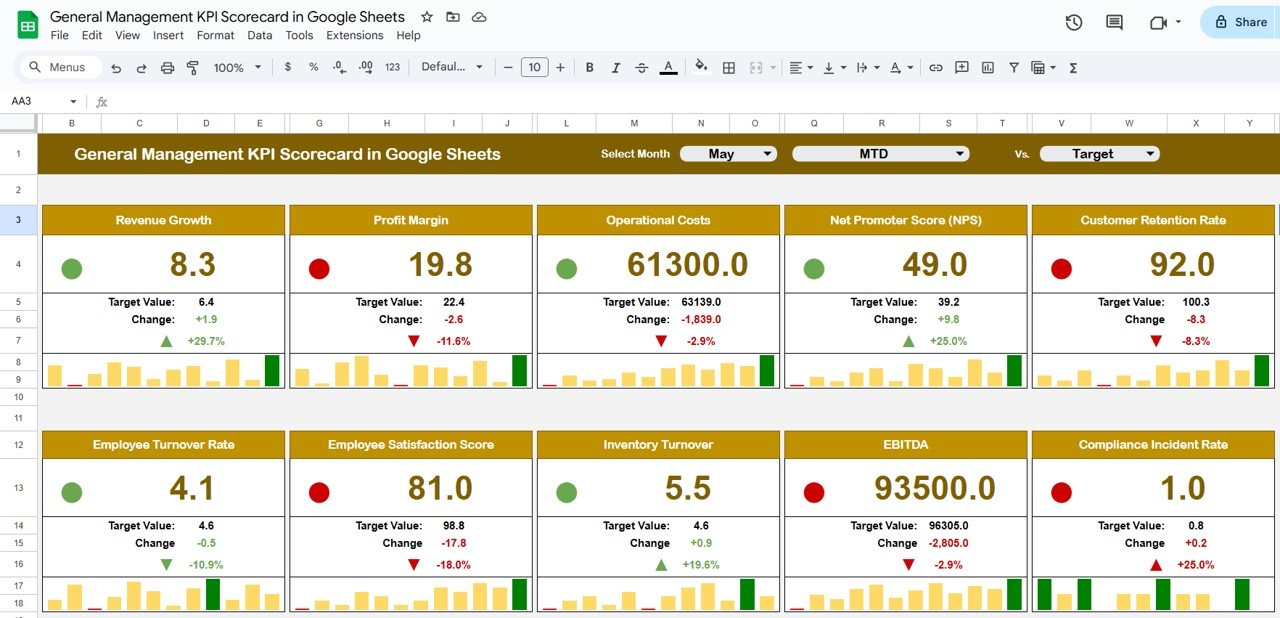
1. Scorecard Sheet
The Scorecard Sheet is the main interface for KPI performance tracking.
Key Features:
-
Dropdown Menus: Select the month, MTD, or YTD to filter performance metrics dynamically
-
Actual vs Target Values: Compare actual performance against predefined targets
-
Visual Indicators: Color-coded visuals and conditional formatting to quickly highlight performance status
-
Comprehensive KPI Overview: Displays MTD and YTD comparisons for multiple KPIs
-
10 KPIs in One View: Track multiple metrics simultaneously for a holistic performance overview
Click to Buy General Management KPI Scorecard in Google Sheets
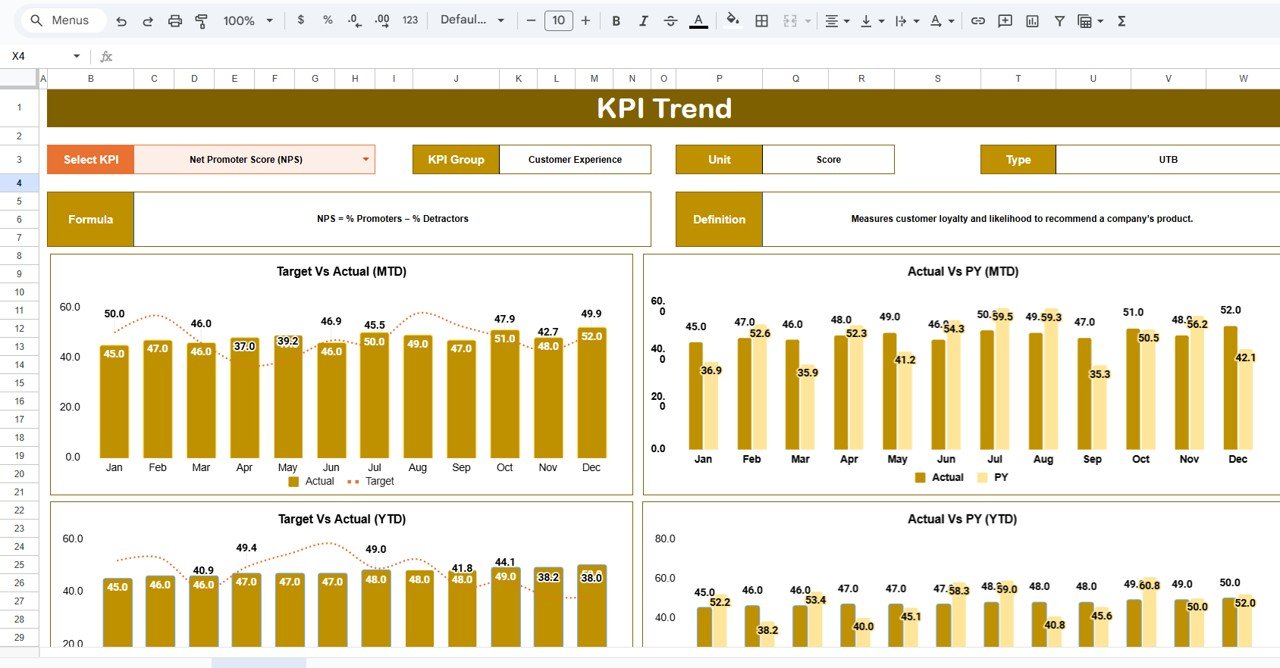
2. KPI Trend Sheet Tab
The KPI Trend Sheet provides detailed analysis and trends for individual KPIs.
Features:
-
Select a KPI using the dropdown in Range C3
-
Displays KPI Group, Unit, KPI Type (Lower-the-Better or Upper-the-Better), Formula, and Definition
-
Visualizes MTD and YTD trends for Actual, Target, and Previous Year (PY) numbers
-
Helps identify patterns, improvements, or declines in performance
Click to Buy General Management KPI Scorecard in Google Sheets
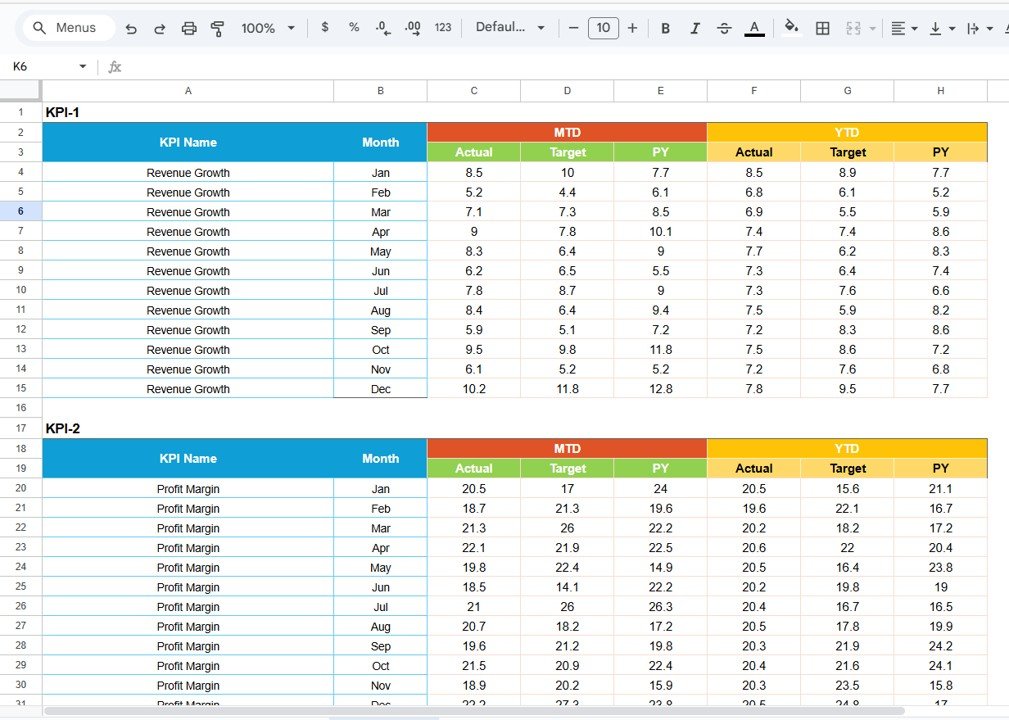
3. Input Data Sheet
The Input Data Sheet is where all KPI data is entered and maintained.
Features:
-
Data Entry: Record actual values, targets, and other relevant metrics for each KPI
-
Flexibility: Easily update data as new results are available, ensuring the scorecard stays current
-
Serves as the backbone for the dashboard and trend visualizations
Click to Buy General Management KPI Scorecard in Google Sheets
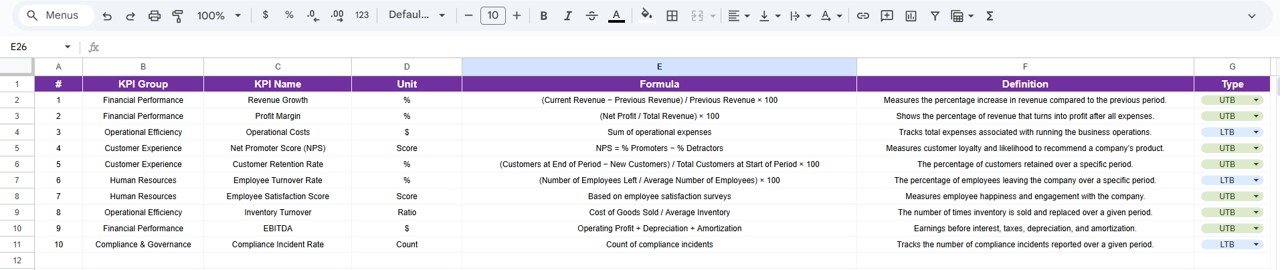
4. KPI Definition Sheet Tab
The KPI Definition Sheet is a reference guide for all KPIs:
-
Enter KPI Name, KPI Group, Unit, Formula, and Definition
-
Ensures consistency and clarity when tracking and reporting performance
-
Acts as a guide for team members using the scorecard for analysis
Click to Buy General Management KPI Scorecard in Google Sheets
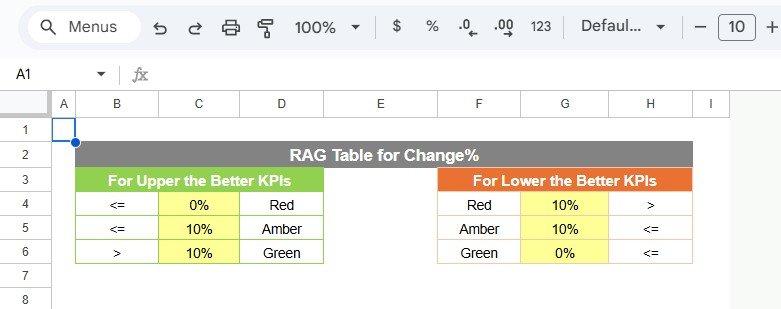
5. Color Settings
Click to Buy General Management KPI Scorecard in Google Sheets
Advantages of Using the KPI Scorecard
-
Centralized Performance Tracking: Consolidates all KPIs in one Google Sheets file
-
Real-Time Insights: MTD and YTD metrics allow for timely performance monitoring
-
Visual Clarity: Conditional formatting and trend charts make analysis intuitive
-
Trend Analysis: Track patterns over time to inform strategic decisions
-
Customizable: Add or remove KPIs to suit organizational goals
-
Data Accuracy: Structured input ensures reliable and consistent reporting
Best Practices for Using the KPI Scorecard
-
Update Data Regularly: Keep the Input Data sheet current to maintain dashboard accuracy
-
Monitor Trends: Use the KPI Trend sheet to identify performance patterns and areas of improvement
-
Set Clear Targets: Ensure each KPI has measurable targets to evaluate success effectively
-
Use Visual Indicators: Conditional formatting helps quickly highlight underperforming areas
-
Review Regularly: Schedule monthly or quarterly reviews to evaluate performance and take corrective actions
-
Customize for Your Organization: Adjust KPIs and formulas to match your company’s strategic goals
How This KPI Scorecard Helps Organizations
Click to Buy General Management KPI Scorecard in Google Sheets
-
Monitor Departmental Performance: Evaluate progress across multiple business units
-
Make Data-Driven Decisions: Use real-time insights to drive operational improvements
-
Track Strategic Goals: Align KPIs with business objectives for effective management
-
Identify Weak Areas: Quickly highlight underperforming metrics for intervention
-
Enhance Accountability: Provide managers and teams with visibility into performance expectations
Frequently Asked Questions (FAQs)
Q1: Can I add more KPIs to the scorecard?
Yes, the scorecard is fully customizable. Add or remove KPIs by updating the KPI Definition and Input Data sheets.
Q2: How do I track both MTD and YTD metrics?
Select the desired period from the dropdown menus on the Scorecard sheet to view corresponding values.
Q3: Can I track previous year (PY) performance?
Yes, the KPI Trend sheet displays PY numbers alongside actual and target values for trend analysis.
Q4: Is this scorecard suitable for large organizations?
Absolutely. Google Sheets allows collaborative editing, making it suitable for teams of any size.
Q5: Can visual indicators help identify performance issues quickly?
Yes, color-coded visuals and conditional formatting highlight KPIs that are meeting or missing targets.
Conclusion
Click to Buy General Management KPI Scorecard in Google Sheets
The General Management KPI Scorecard in Google Sheets is a comprehensive, ready-to-use tool for tracking organizational performance. By consolidating KPIs, visualizing trends, and providing actionable insights, this scorecard empowers managers to monitor progress, make data-driven decisions, and achieve business objectives effectively.General Management KPI Scorecard in Google Sheets
Visit our YouTube channel to learn step-by-step video tutorials
Youtube.com/@NeotechNavigators
Watch the step-by-step video Demo:
Click to Buy General Management KPI Scorecard in Google Sheets