Managing a golf course effectively requires monitoring multiple performance indicators, including rounds played, revenue, customer satisfaction, and operational efficiency. The Golf Course KPI Dashboard in Google Sheets is a ready-to-use solution that consolidates all essential KPIs into a single, interactive dashboard.
This article explains the features, advantages, best practices, and usage of this golf course performance dashboard.
What Is a Golf Course KPI Dashboard?
A Golf Course KPI Dashboard is a digital tool designed to track, analyze, and visualize key metrics for golf course operations. By consolidating monthly and yearly performance data, managers can:
-
Monitor operational efficiency
-
Track financial performance and revenue streams
-
Evaluate customer satisfaction and engagement
-
Compare actual performance against targets and previous year metrics
-
Make data-driven decisions to optimize performance
Using Google Sheets makes this dashboard accessible, collaborative, and easy to maintain.
Key Features of the Golf Course KPI Dashboard
The dashboard is organized into six worksheets, each providing unique insights:
1. Dashboard Sheet Tab
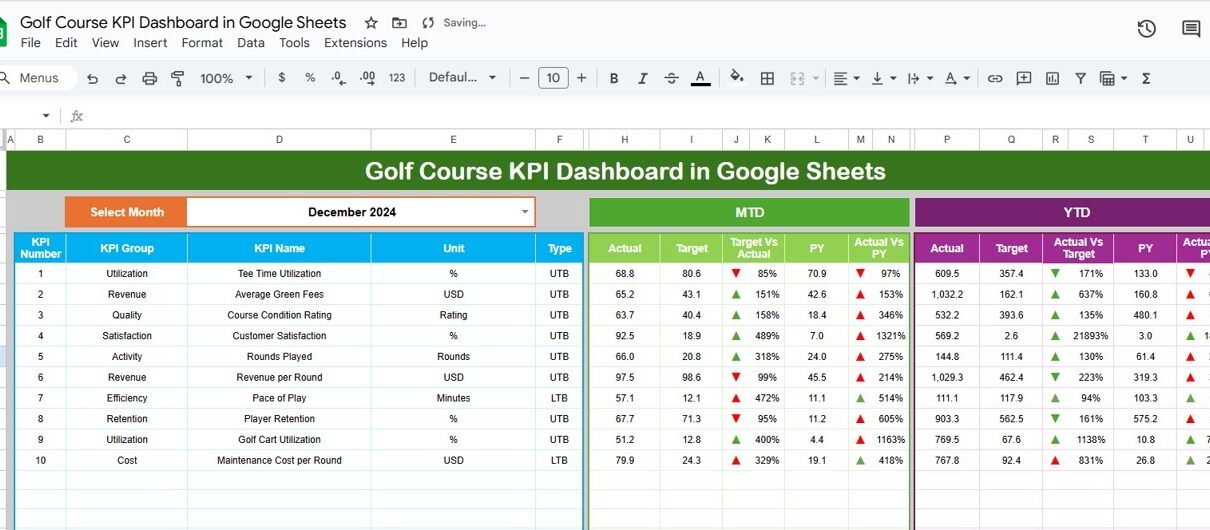
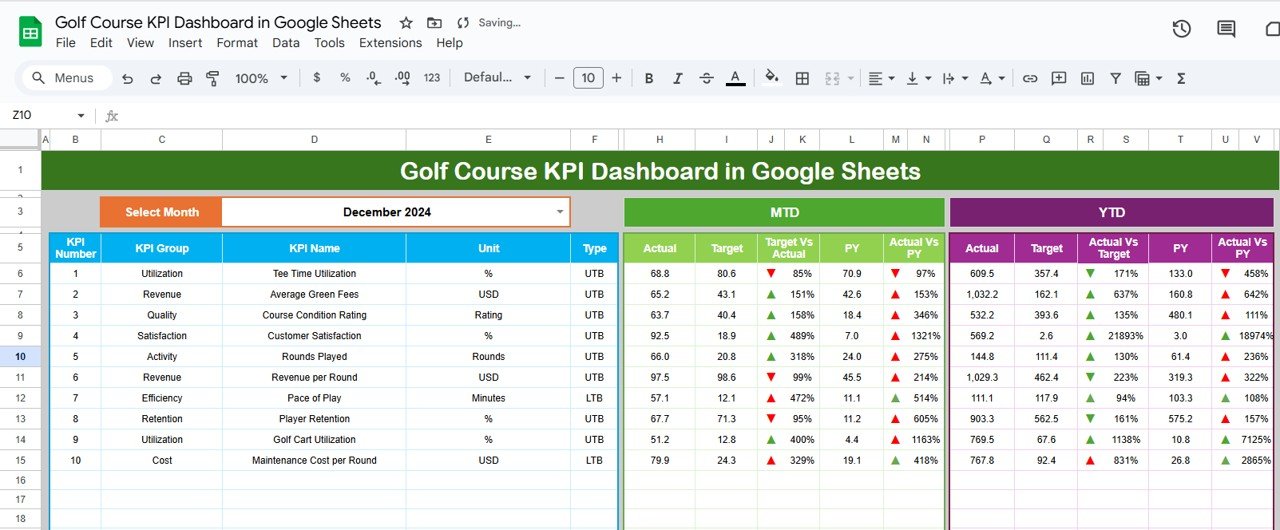
The Dashboard Sheet is the main page, displaying all KPI metrics.
Key features:
-
Month Selection Dropdown (Range D3): Automatically updates dashboard numbers for the selected month
-
MTD Metrics: Actual, Target, and Previous Year values with Target vs Actual and PY vs Actual comparisons
-
YTD Metrics: Year-to-date performance with the same visual comparisons
-
Conditional Formatting: Up and down arrows indicate performance against targets
This sheet provides a comprehensive overview of all KPIs at a glance.
Click to Buy Golf Course KPI Dashboard in Google Sheets
2. KPI Trend Sheet Tab
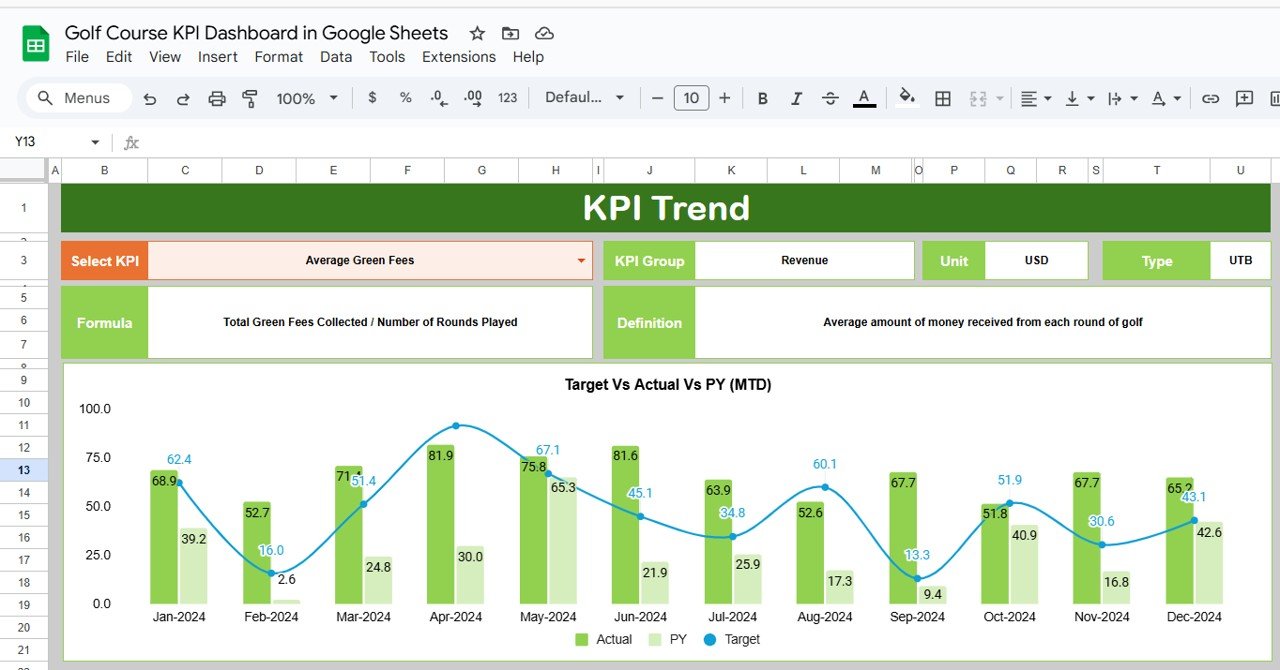
The KPI Trend Sheet allows managers to analyze individual KPI performance.
Features include:
-
Select a KPI from the dropdown in Range C3
-
Display KPI Group, Unit, Type (Lower-the-Better or Upper-the-Better)
-
Show KPI Formula and Definition
-
Visualize trends over time to monitor improvements or identify issues
This sheet is ideal for performance evaluation and decision-making.
Click to Buy Golf Course KPI Dashboard in Google Sheets
3. Actual Number Sheet Tab
-
Input actual KPI numbers for both MTD and YTD
-
Update the first month of the year in Range E1 to adjust calculations
-
Ensures accurate, real-time reporting in the dashboard

4. Target Sheet Tab
-
Enter monthly and yearly target values for each KPI
-
Compare actual performance against goals
-
Helps track achievement and identify areas needing improvement

Click to Buy Golf Course KPI Dashboard in Google Sheets
5. Previous Year Numbers Sheet Tab
-
Enter previous year metrics to enable year-over-year comparisons
-
Allows managers to monitor trends and performance improvements over time

6. KPI Definition Sheet Tab
Document all KPI details, including:
- KPI Name
- KPI Group
- Unit
- Formula
- KPI Definition
- Type (Upper-the-Better or Lower-the-Better)
This sheet ensures clarity and consistency in measuring and tracking performance.

Click to Buy Golf Course KPI Dashboard in Google Sheets
Advantages of Using the Golf Course KPI Dashboard
-
Centralized Data: Consolidates all golf course metrics in one dashboard
-
Real-Time Monitoring: Track performance as new data is entered
-
Trend Analysis: Compare current performance to previous months and years
-
Operational Insights: Identify areas of inefficiency or underperformance
-
Customer Experience Monitoring: Evaluate satisfaction and engagement metrics
-
Customizable: Add new KPIs or modify existing ones to match your course’s goals
Best Practices for Using the Dashboard
Click to Buy Golf Course KPI Dashboard in Google Sheets
-
Regularly Update Actual Numbers: Keep the data current to maintain accuracy
-
Set Realistic Targets: Ensure targets are aligned with your golf course goals
-
Monitor MTD and YTD Metrics: Track monthly performance and cumulative progress
-
Analyze KPI Trends: Use the KPI Trend sheet to evaluate long-term patterns
-
Segment Data by Category: Track performance by membership type, location, or revenue stream
-
Review Performance Regularly: Make data-driven decisions for operational improvements
How This Dashboard Helps Golf Course Managers
-
Optimize Operations: Monitor rounds played, staffing efficiency, and maintenance schedules
-
Improve Customer Experience: Identify and address areas of dissatisfaction
-
Boost Revenue: Track green fees, memberships, and additional services
-
Support Strategic Planning: Make informed decisions based on KPI trends
-
Enhance Member Engagement: Monitor satisfaction and loyalty indicators
Frequently Asked Questions (FAQs)
Click to Buy Golf Course KPI Dashboard in Google Sheets
Q1: Can I add custom KPIs to this dashboard?
Yes, you can add or modify KPIs in the KPI Definition Sheet.
Q2: Can multiple staff members update the dashboard simultaneously?
Yes, Google Sheets supports real-time collaboration for multiple users.
Q3: Can I track KPIs by location or course section?
Absolutely, you can segment data to track specific areas or courses.
Q4: How often should I update MTD and YTD metrics?
Monthly updates are recommended, but you can update more frequently if needed.
Q5: Does this dashboard allow year-over-year comparison?
Yes, using the Previous Year Numbers sheet, you can track growth and performance trends.
Conclusion
The Golf Course KPI Dashboard in Google Sheets is a comprehensive, ready-to-use tool that helps managers track performance, optimize operations, and enhance member experience. By combining MTD and YTD metrics, trend analysis, and clear KPI definitions, this dashboard empowers golf course managers to make informed, data-driven decisions.
Visit our YouTube channel to learn step-by-step video tutorials
Youtube.com/@NeotechNavigators
