Sustainability is no longer optional. Organizations must reduce energy usage, control water consumption, and manage waste effectively. However, many companies still track environmental performance using disconnected reports. As a result, leaders struggle to monitor sustainability metrics clearly.
Therefore, you need a centralized and structured system.Green Workplace Performance Dashboard in Google Sheets
The Green Workplace Performance Dashboard in Google Sheets is a ready-to-use sustainability analytics solution. It helps organizations monitor energy, water, occupancy, and departmental performance in one interactive dashboard.
Let us explore each page in detail.Green Workplace Performance Dashboard in Google Sheets
What Is the Green Workplace Performance Dashboard in Google Sheets?
Click to Buy Green Workplace Performance Dashboard in Google Sheets
This dashboard is a cloud-based sustainability monitoring system designed for:
- Corporate offices
- IT parks
- Business campuses
- Operations centers
- Multi-location organizations
It provides real-time insights into:
- Total Seats
- Occupied Seats
- Total Energy Consumption (kWh)
- Energy Cost (USD)
- Water Consumption (m³)
- Waste Generation (kg)
Because it uses Google Sheets, teams can collaborate easily and access reports from anywhere.
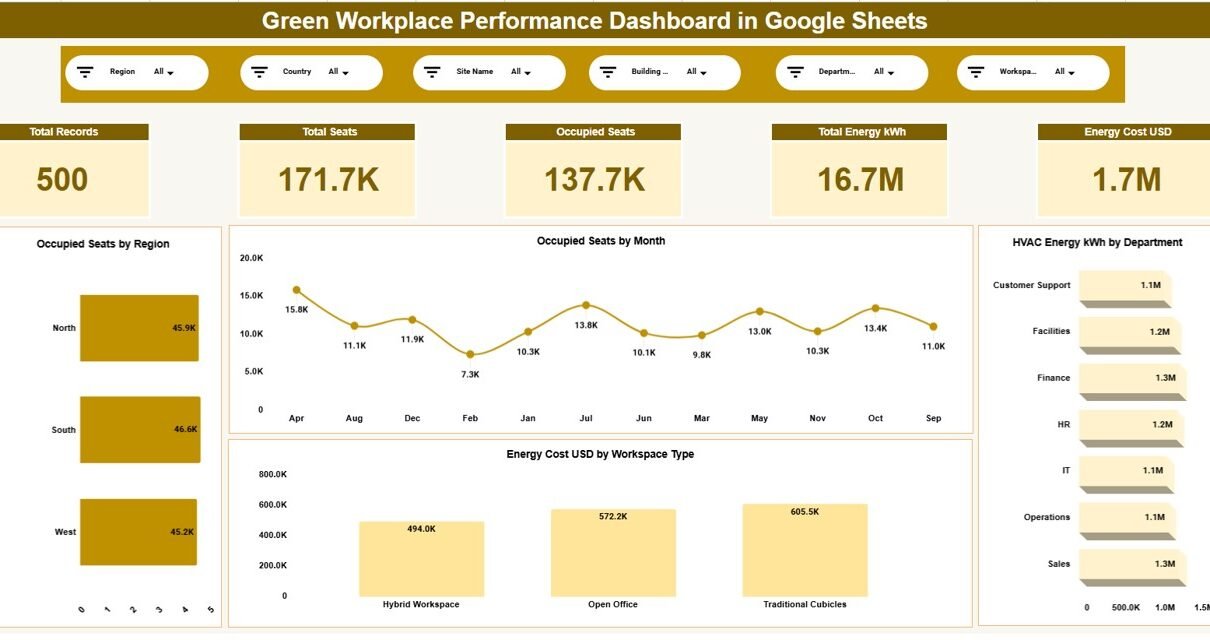
Green Workplace Performance Dashboard (Overview)
The first page acts as the executive summary.
🔹 Key KPI Cards
- Total Records: 500
- Total Seats: 171.7K
- Occupied Seats: 137.7K
- Total Energy kWh: 16.7M
- Energy Cost USD: 1.7M
These KPI cards provide instant sustainability visibility.
Key Visual Reports
Occupied Seats by Region
Compare occupancy levels across:
Occupied Seats by Month
Energy Cost by Workspace Type
HVAC Energy kWh by Department

Click to Buy Green Workplace Performance Dashboard in Google Sheets
Energy Analysis – Monitor Energy Efficiency
Energy management plays a major role in sustainability goals.
This page focuses on:
-
Total Energy kWh by Building Type
-
Grid Energy kWh by Weekday
-
Renewable Energy kWh by Region
-
IT Energy kWh by Department
For example:
-
Operations Center consumes 4.4M kWh
-
Monday records highest grid energy usage
-
Renewable energy usage differs across regions
Therefore, managers identify energy-saving opportunities easily.

Click to Buy Green Workplace Performance Dashboard in Google Sheets
Water Management – Track Water Usage & Waste
Water conservation supports ESG goals. Therefore, this page focuses on water and waste analytics.
🔹 Key Metrics
-
Average Water Intensity per Seat
-
Water Cost USD by Region
-
Water Consumption m³ by Department
-
Total Waste kg by City
For instance:
-
West region records $7.1K water cost
-
Delhi generates 753 kg waste
-
Facilities department consumes more water than other teams
As a result, sustainability teams implement corrective measures quickly.

Click to Buy Green Workplace Performance Dashboard in Google Sheets
Department Analysis – Department-Level Sustainability Tracking
This page provides department-level insights.
🔹 Key Reports
-
Total Seats by Department
-
Occupied Seats by Department
-
Energy Cost USD by Department
-
Water Cost USD by Department
For example:
-
Sales department has 26.7K seats
-
HR department energy cost exceeds $240K
-
IT department water cost remains moderate
Because this page breaks down metrics department-wise, leadership improves accountability.

Click to Buy Green Workplace Performance Dashboard in Google Sheets
Why Use Google Sheets for Green Workplace Analytics?
Google Sheets offers:
-
Cloud-based accessibility
-
Real-time collaboration
-
Automatic saving
-
Easy sharing with management
-
No software installation
Therefore, both small and large companies benefit from this solution.
Advantages of Green Workplace Performance Dashboard in Google Sheets
Click to Buy Green Workplace Performance Dashboard in Google Sheets
Centralized Sustainability Monitoring
You track energy, water, waste, and occupancy in one system.
Real-Time Filtering
You analyze data by region, department, and building instantly.
ESG Reporting Support
You generate structured environmental reports easily.
Cost Optimization
You identify high-cost departments quickly.
Improved Decision-Making
You make sustainability decisions using real data.
Ready-to-Use Format
You only need to input data.
Best Practices for the Green Workplace Performance Dashboard
Click to Buy Green Workplace Performance Dashboard in Google Sheets
To maximize effectiveness:
1. Update Data Monthly
Maintain consistent data entry.
2. Monitor Renewable Energy Trends
Increase renewable share gradually.
3. Compare Weekday Energy Usage
Identify peak consumption days.
4. Track Water Intensity per Seat
Reduce water waste through policy changes.
5. Review Department Performance Quarterly
Encourage sustainable practices.
6. Use Data for ESG Reporting
Align metrics with sustainability frameworks.
Who Should Use This Dashboard?
Click to Buy Green Workplace Performance Dashboard in Google Sheets
-
Corporate sustainability teams
-
ESG reporting managers
-
Facility management teams
-
Operations heads
-
Energy managers
If your organization wants structured green performance monitoring, this dashboard delivers strong insights.
Conclusion
Sustainability requires data-driven decisions. However, scattered spreadsheets slow down performance monitoring.
The Green Workplace Performance Dashboard in Google Sheets provides a ready-to-use, interactive, and collaborative solution. It tracks energy consumption, water management, occupancy levels, and departmental costs in one unified system.
Visit our YouTube channel to learn step-by-step video tutorials
Youtube.com/@NeotechNavigators
Watch the step-by-step video tutorial:
Click to Buy Green Workplace Performance Dashboard in Google Sheets