The Heavy Machinery KPI Dashboard in Google Sheets is a powerful, ready-to-use analytics tool designed for construction, mining, logistics, and manufacturing companies to monitor the performance, utilization, and efficiency of heavy equipment.Heavy Machinery KPI Dashboard in Google Sheets
It provides real-time insights into equipment uptime, maintenance cost, fuel consumption, downtime, and overall operational performance — all in one automated dashboard.Heavy Machinery KPI Dashboard in Google Sheets
What Is a Heavy Machinery KPI Dashboard in Google Sheets?
A Heavy Machinery KPI Dashboard is a performance measurement system that consolidates data from multiple sources — such as equipment logs, maintenance reports, and operational data — into a single view.
It helps organizations track machine efficiency, cost, and maintenance trends, compare actuals vs. targets, and identify performance bottlenecks using dynamic visualizations and conditional formatting.
All this is managed directly in Google Sheets — no coding or complex setup required.
Dashboard Structure
Click to Buy Heavy Machinery KPI Dashboard in Google Sheets
This KPI dashboard contains six key worksheets:
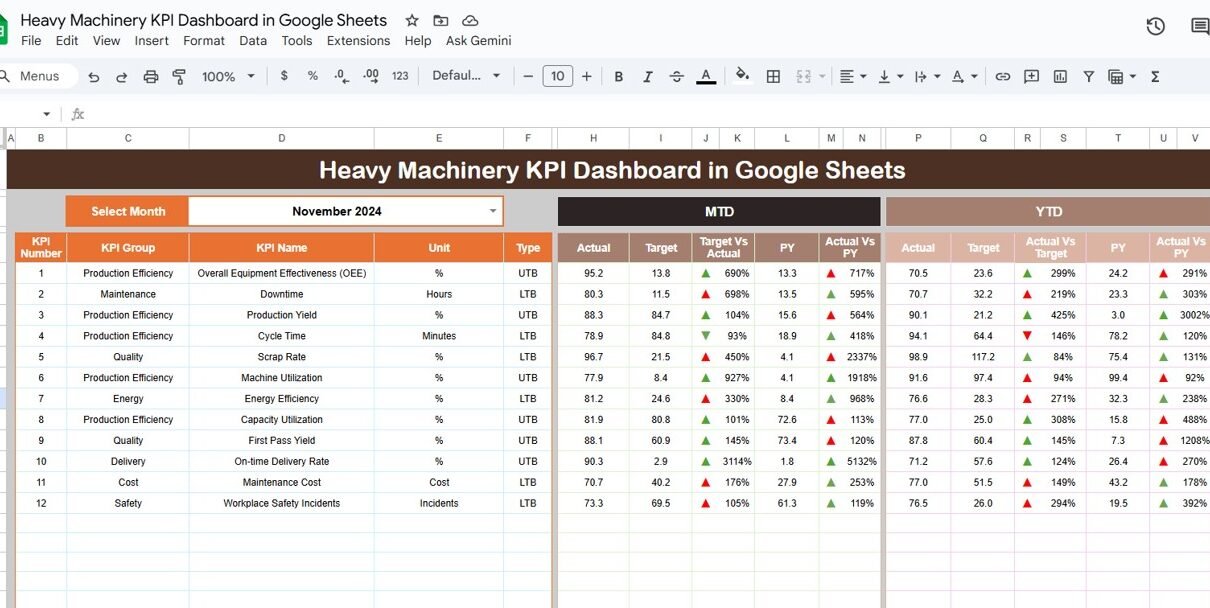
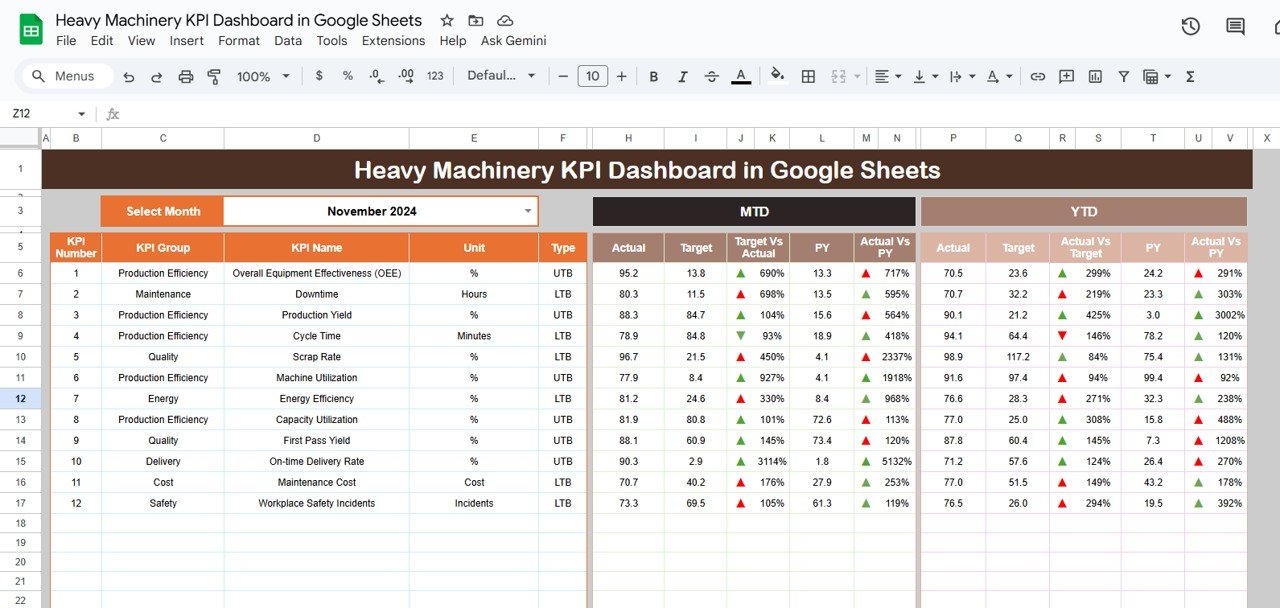
Dashboard Sheet Tab
This is the main page where all KPIs are summarized and visualized.
-
The Month Selector (cell D3) dynamically updates all metrics.
-
Displays MTD and YTD actual, target, and previous year values.
-
Uses conditional formatting with color-coded up/down arrows to indicate KPI performance.
📋 Key KPI Cards Displayed:
-
Total Machines in Operation
-
Average Equipment Utilization (%)
-
Average Downtime (hrs)
-
Maintenance Cost ($)
-
Fuel Consumption (liters)
-
Cost per Operating Hour ($)
-
Breakdown Frequency (%)
-
Preventive Maintenance Compliance (%)
-
Availability Rate (%)
-
Operator Efficiency (%)
Click to Buy Heavy Machinery KPI Dashboard in Google Sheets
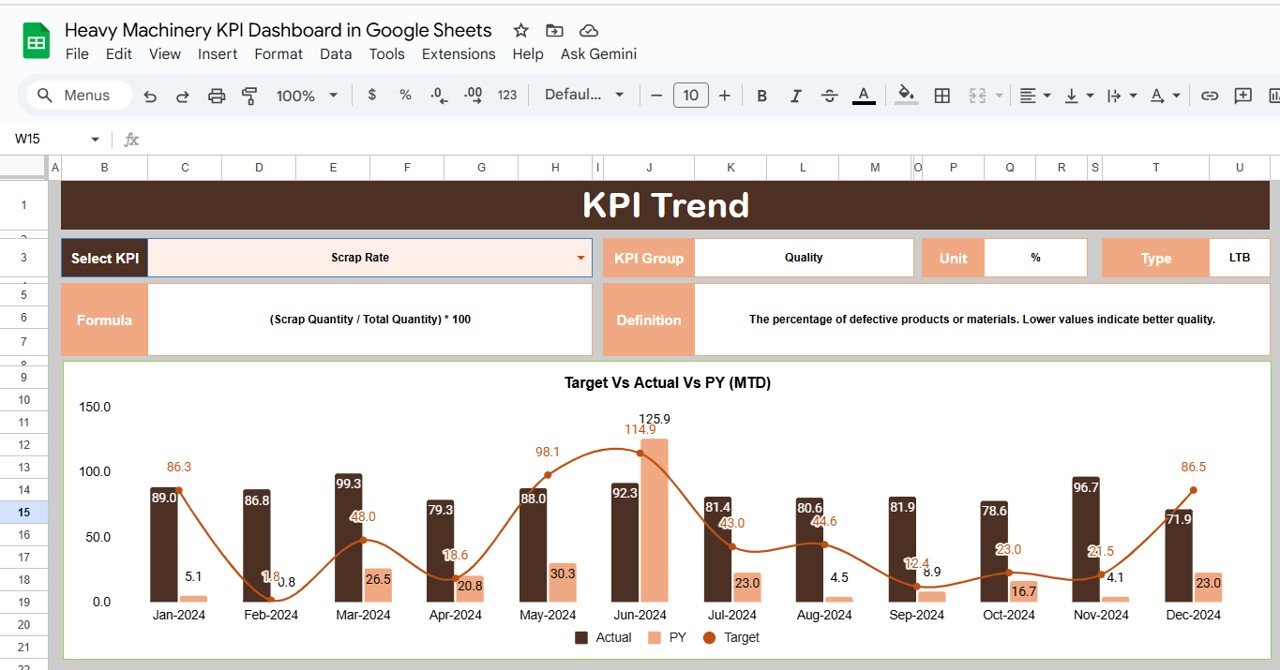
KPI Trend Sheet Tab
This tab allows deeper KPI analysis:
-
Select the KPI name using the dropdown in Range C3.
-
View KPI Group, Unit, Type (UTB/LTB), Formula, and Definition.
-
Visualize MTD/YTD performance over time with dynamic charts.
Click to Buy Heavy Machinery KPI Dashboard in Google Sheets
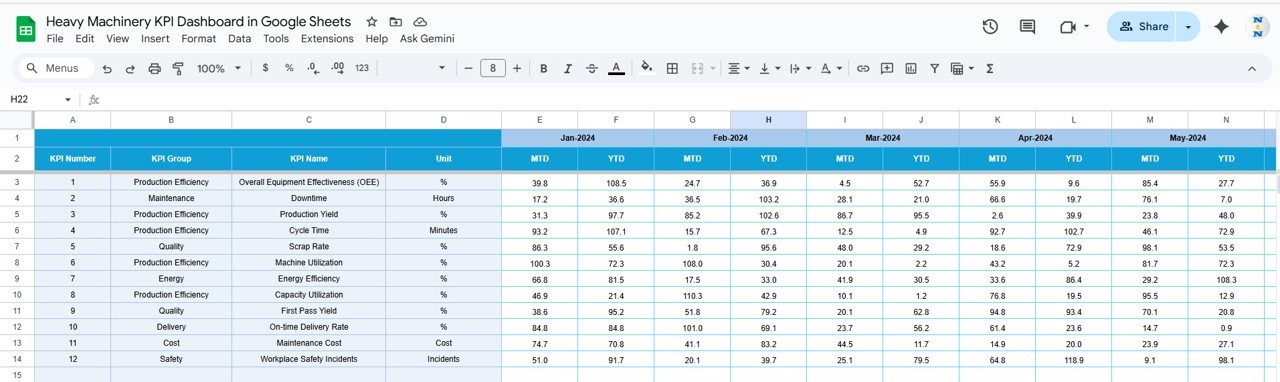
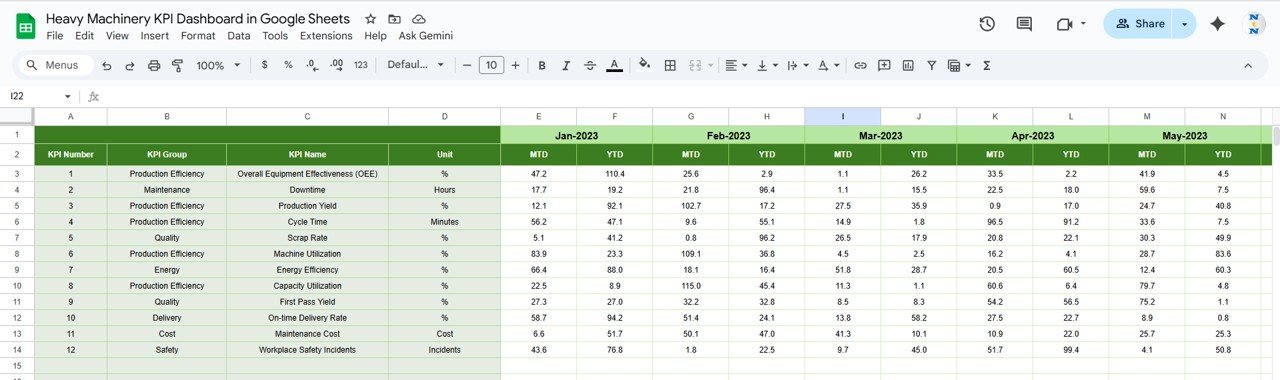
Actual Number Sheet Tab
The Actual Data Input Sheet holds monthly values for each KPI.
-
Update MTD and YTD data per month.
-
Use cell E1 to set the month, and all visuals refresh automatically.
Click to Buy Heavy Machinery KPI Dashboard in Google Sheets
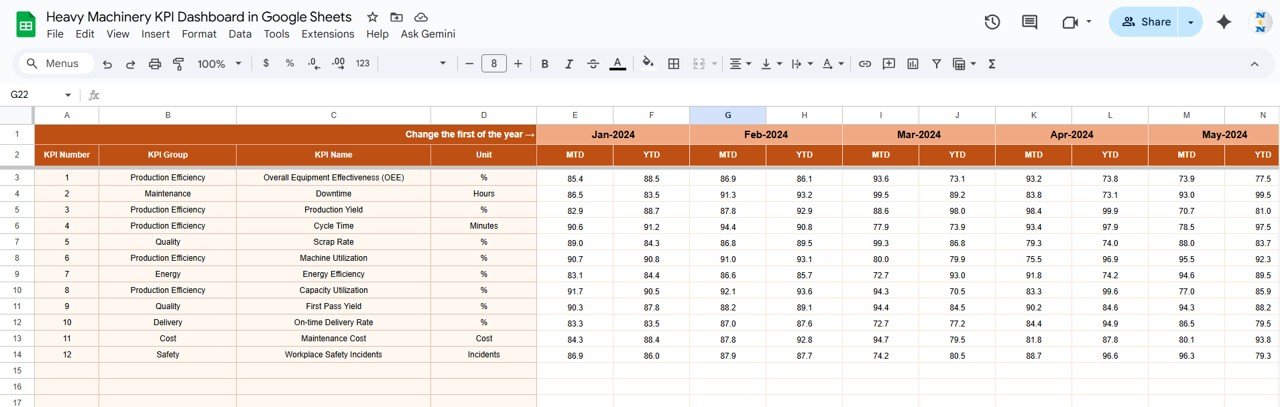
Target Sheet Tab
Here, enter MTD and YTD targets for every KPI to benchmark actual performance.
Previous Year Number Sheet Tab
Stores historical performance data to support year-over-year analysis and highlight long-term trends.
Click to Buy Heavy Machinery KPI Dashboard in Google Sheets
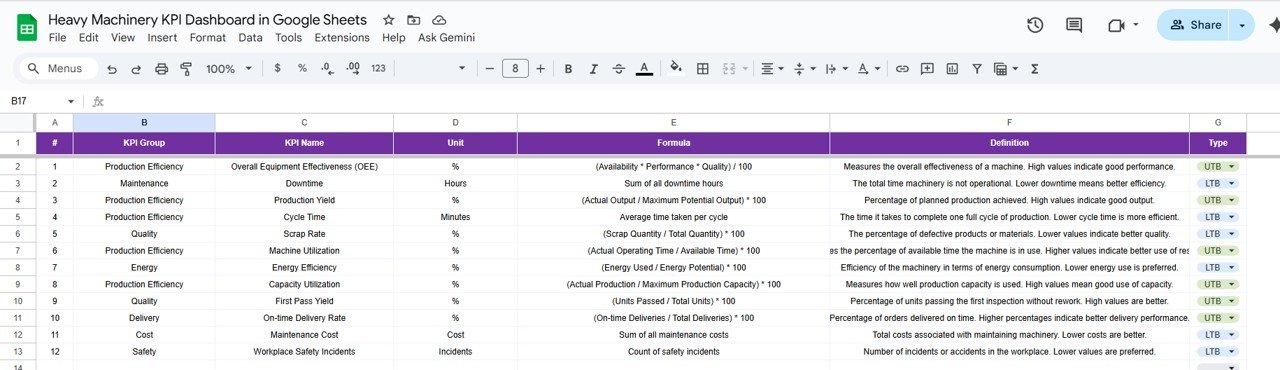
KPI Definition Sheet Tab
Defines each KPI clearly with its group, unit, formula, definition, and performance direction (UTB/LTB) for reference and standardization.
Advantages
-
🚜 Comprehensive Equipment Monitoring: Tracks utilization, cost, fuel, and downtime metrics.
-
🧮 Automated Calculations: Fully formula-driven system with minimal manual work.
-
📊 Performance Insights: Identify cost inefficiencies and low-performing assets instantly.
-
☁️ Google Sheets Collaboration: Enables real-time team access and analysis.
-
📈 Multi-Period Comparison: Supports MTD, YTD, and YoY performance analytics.
Opportunities for Improvement
Click to Buy Heavy Machinery KPI Dashboard in Google Sheets
-
Add GPS or telematics integration for live data sync.
-
Introduce fuel efficiency KPIs per machine category.
-
Include CO₂ emission estimates for sustainability tracking.
-
Implement maintenance forecasting using linear regression.
-
Add alerts and color thresholds for critical KPIs.
Best Practices
-
Record actuals weekly to maintain accuracy.
-
Separate fixed and variable costs in maintenance data.
-
Review operator efficiency quarterly.
-
Track preventive maintenance completion monthly.
-
Benchmark performance by machine model or supplier.
Conclusion
Click to Buy Heavy Machinery KPI Dashboard in Google Sheets
The Heavy Machinery KPI Dashboard in Google Sheets empowers industrial and construction organizations to monitor equipment utilization, cost efficiency, maintenance compliance, and operator productivity — all in one integrated platform.
It enables faster decision-making, minimizes downtime, and ensures optimal equipment performance with real-time analytics and visual insights.
Visit our YouTube channel to learn step-by-step video tutorials
Youtube.com/@NeotechNavigators
Watch the step-by-step video Demo: