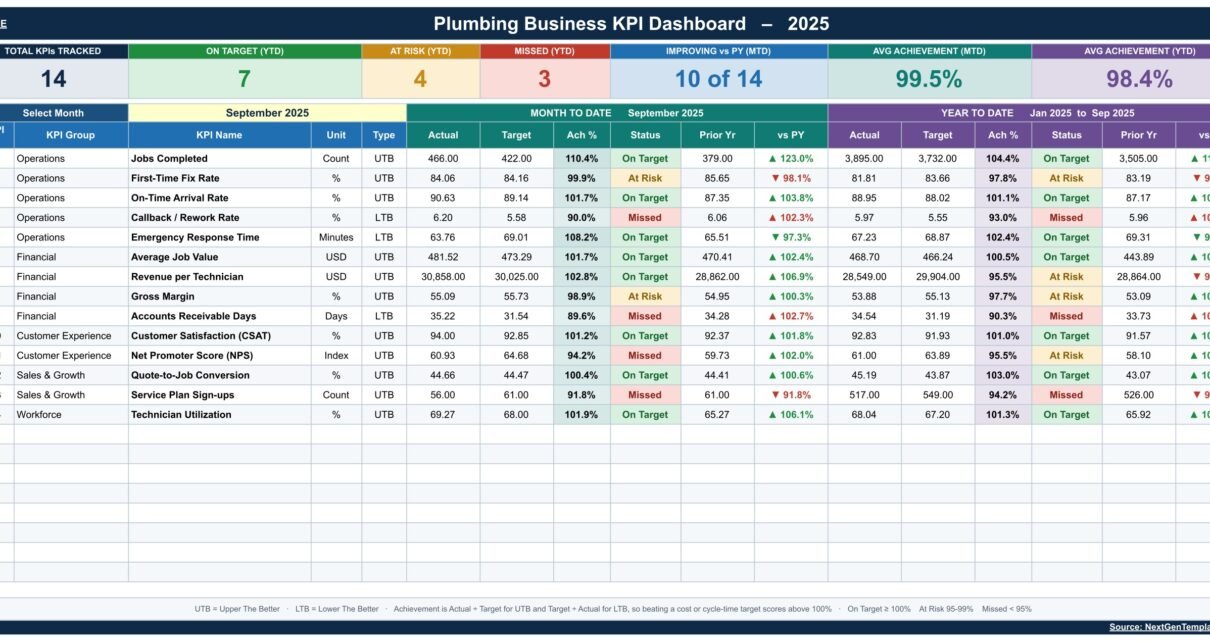
Track 14 plumbing KPIs across 5 groups in Google Sheets. One month picker drives MTD and YTD achievement, traffic lights, a per-KPI trend page and a group analysis page. No add-ons, no scripts.
Online Tutorial for Data Analysis and Automation
Track 14 plumbing KPIs across 5 groups in Google Sheets. One month picker drives MTD and YTD achievement, traffic lights, a per-KPI trend page and a group analysis page. No add-ons, no scripts.
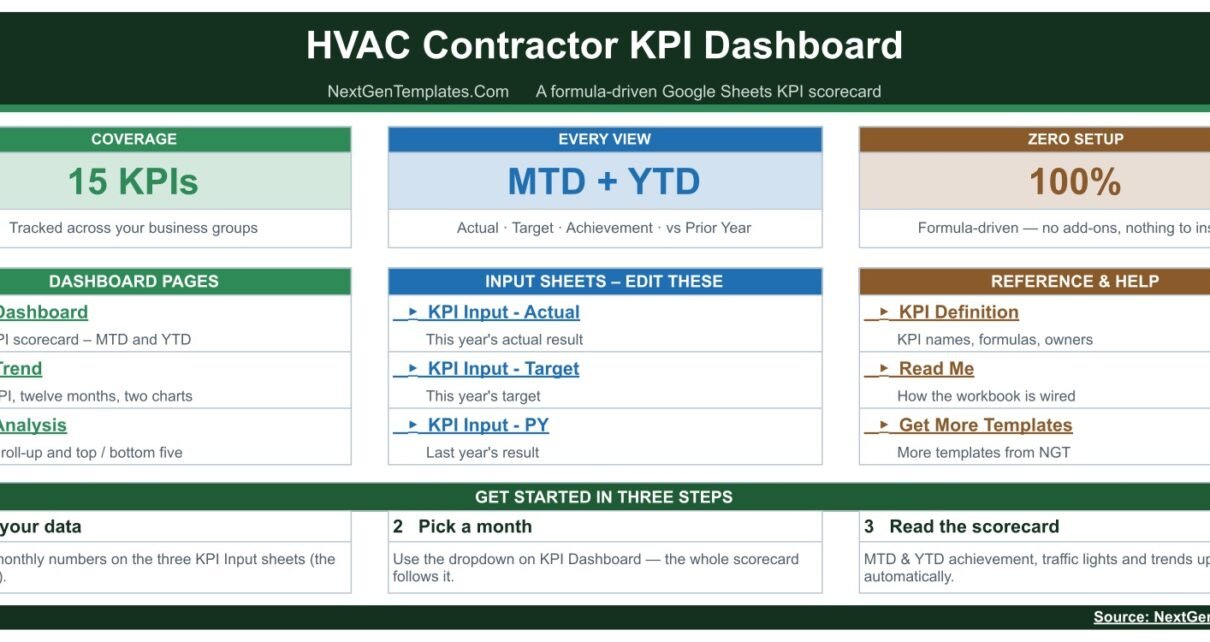
Track 15 HVAC contractor KPIs in Google Sheets with MTD and YTD achievement, prior-year comparison and traffic-light status. One month dropdown drives the scorecard, the KPI Trend page and the group analysis – formula-driven, nothing to install.
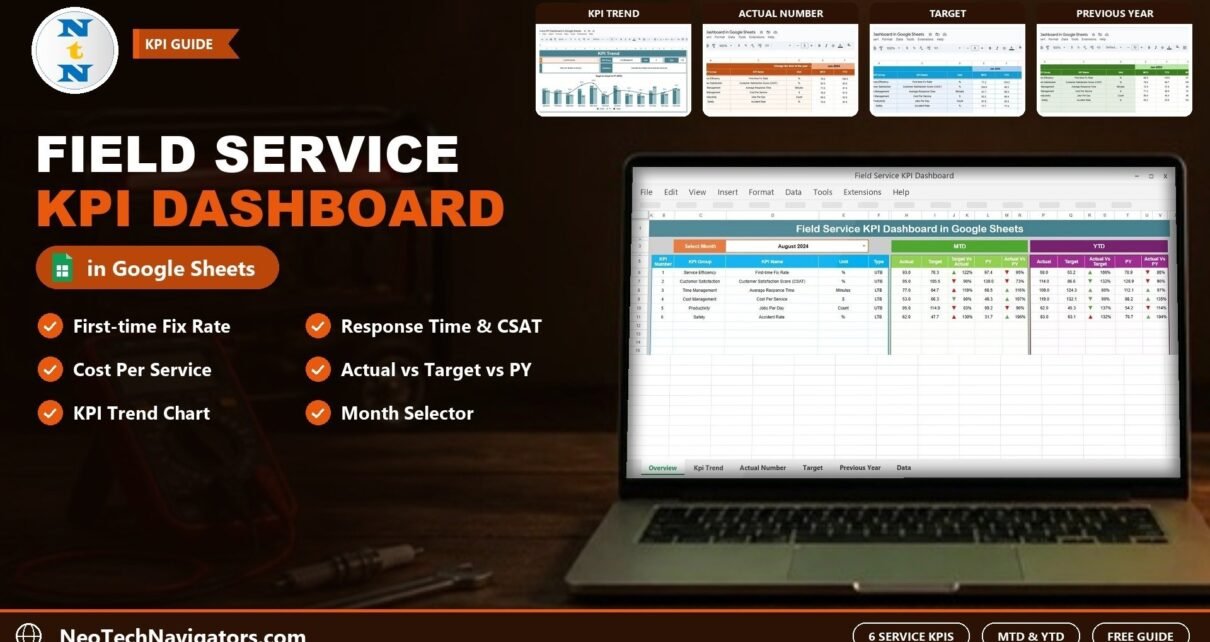
A Google Sheets KPI dashboard for field service teams that tracks First-time Fix Rate, CSAT, Average Response Time, Cost Per Service, Jobs Per Day and Accident Rate with MTD/YTD Actual vs Target vs Previous Year.
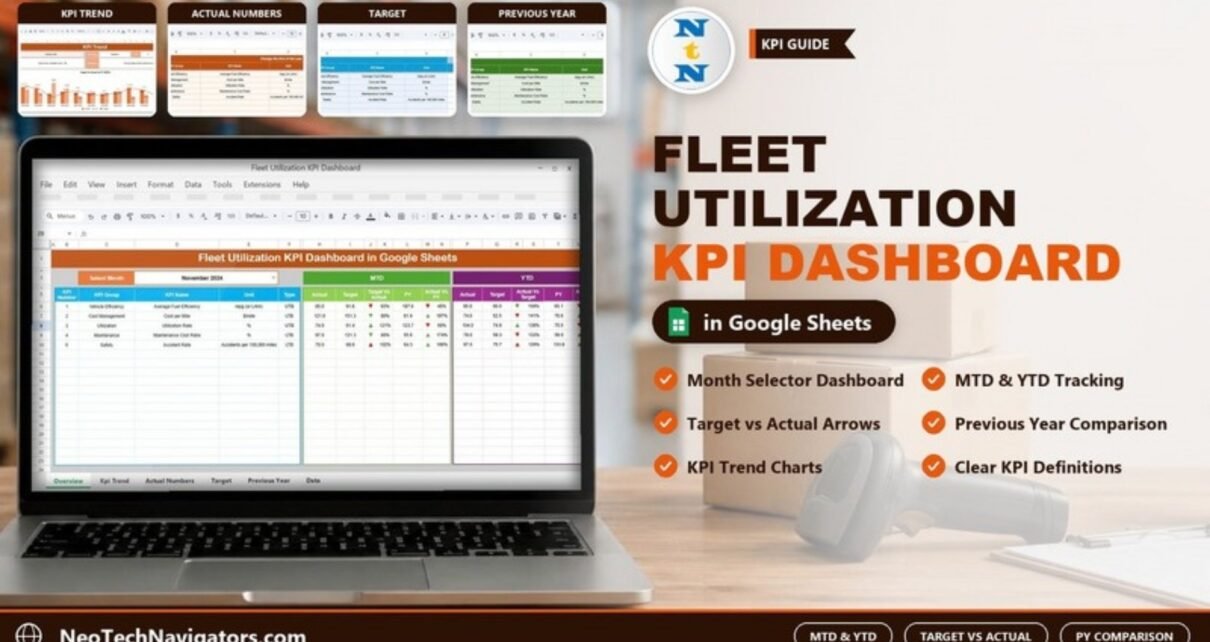
How the Fleet Utilization KPI Dashboard in Google Sheets compares five fleet KPIs (fuel efficiency, cost per mile, utilization rate, maintenance cost ratio and accident rate) with targets and last year on an MTD and YTD basis, with formulas and setup steps.
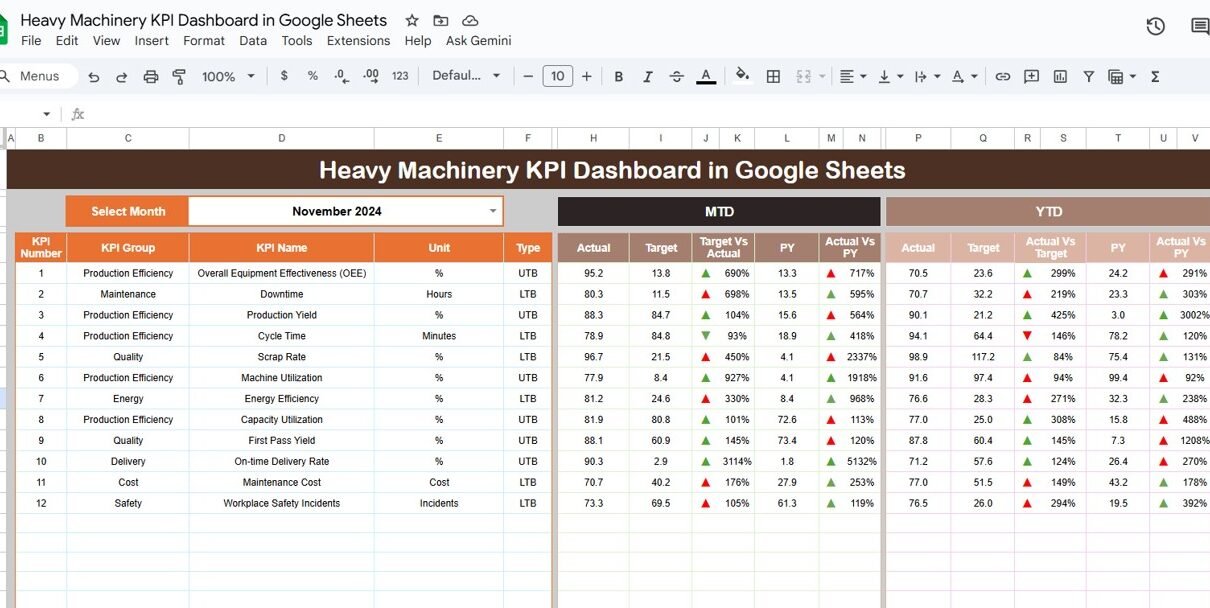
The Heavy Machinery KPI Dashboard in Google Sheets is a powerful, ready-to-use analytics tool designed for construction, mining, logistics, and manufacturing companies to monitor the performance, utilization, and efficiency of heavy equipment.Heavy Machinery KPI Dashboard in Google Sheets It provides real-time insights into equipment uptime, maintenance cost, fuel consumption, downtime, and overall operational performance — […]