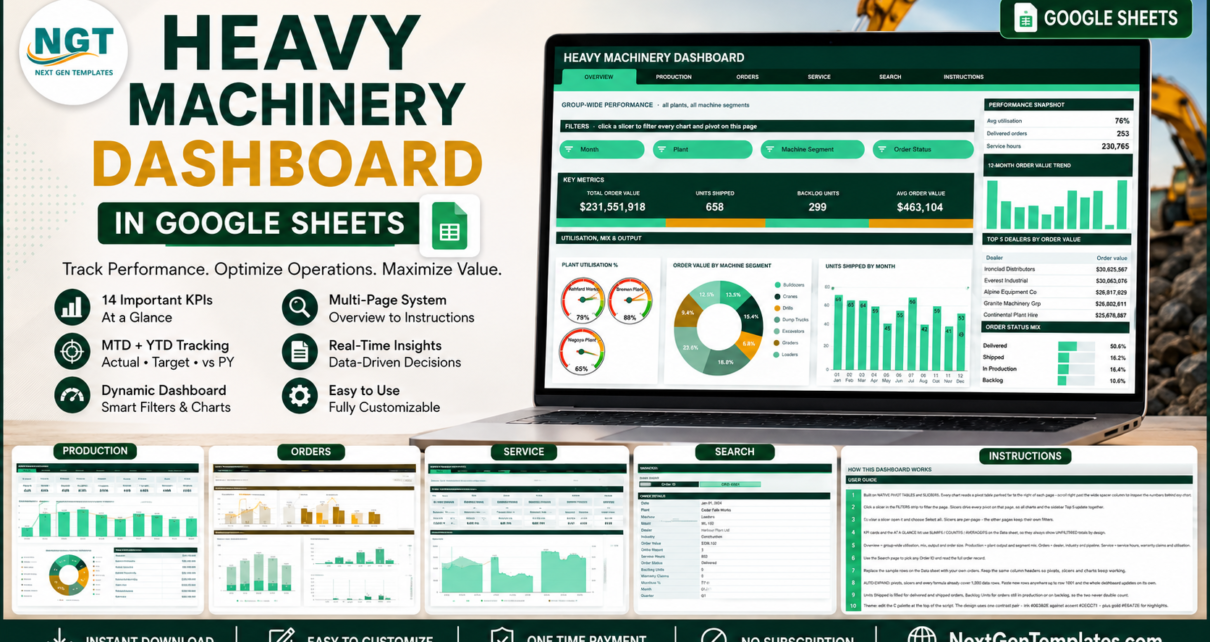
The Heavy Machinery Dashboard in Google Sheets tracks 16 KPI cards and 18 charts across 6 pages, driven by 15 native slicers over a 500-order book that auto-expands to 1,000 rows. Built on real pivot tables, it covers plant output, dealer orders, backlog and warranty service in one browser file.
Tag: machinery utilization report
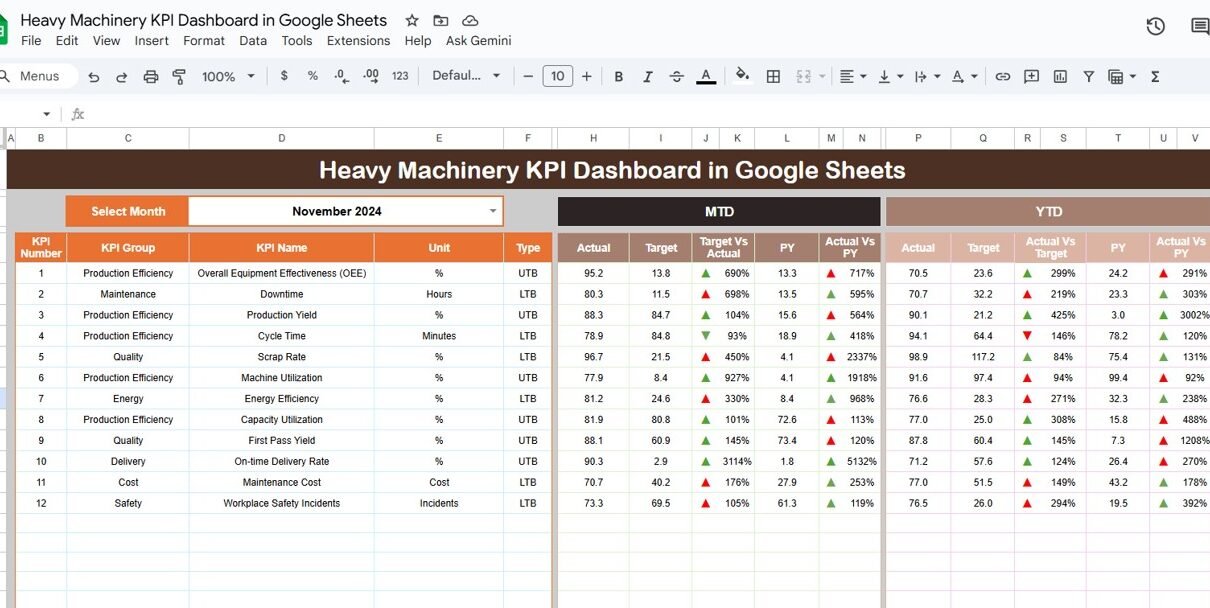
Heavy Machinery KPI Dashboard in Google Sheets
The Heavy Machinery KPI Dashboard in Google Sheets is a powerful, ready-to-use analytics tool designed for construction, mining, logistics, and manufacturing companies to monitor the performance, utilization, and efficiency of heavy equipment.Heavy Machinery KPI Dashboard in Google Sheets It provides real-time insights into equipment uptime, maintenance cost, fuel consumption, downtime, and overall operational performance — […]