In today’s competitive hospitality industry, data-driven decisions are key to staying ahead of the competition. Hospitality businesses, whether hotels, resorts, or restaurants, must track multiple key performance indicators (KPIs) to measure their success. A Hospitality KPI Dashboard in Google Sheets is a powerful tool that enables business owners and managers to monitor their performance, identify areas for improvement, and make informed decisions to boost growth.
This article dives into the specifics of creating a Hospitality KPI Dashboard in Google Sheets, its key features, and how it helps you track essential metrics effectively. We will cover all the KPIs, provide definitions, the units of measurement, formulas for aggregation, and specify whether each KPI is lower the better or upper the better.
What is a Hospitality KPI Dashboard?
A Hospitality KPI Dashboard is a dynamic tool used by hospitality managers to track various performance metrics. These KPIs help businesses gauge their success in different areas such as customer satisfaction, financial performance, operational efficiency, and employee productivity. Using Google Sheets for this purpose offers several advantages, such as ease of access, real-time updates, and seamless collaboration among team members.
With a Hospitality KPI Dashboard in Google Sheets, managers can monitor their business metrics and respond promptly to any emerging trends or issues. The dashboard provides a clear, visual representation of data that helps stakeholders make faster, better decisions.
Key Features of the Hospitality KPI Dashboard in Google Sheets
The Hospitality KPI Dashboard in Google Sheets includes six key worksheets, each serving a distinct purpose to ensure all necessary data points are captured and organized. Here’s an overview of each:
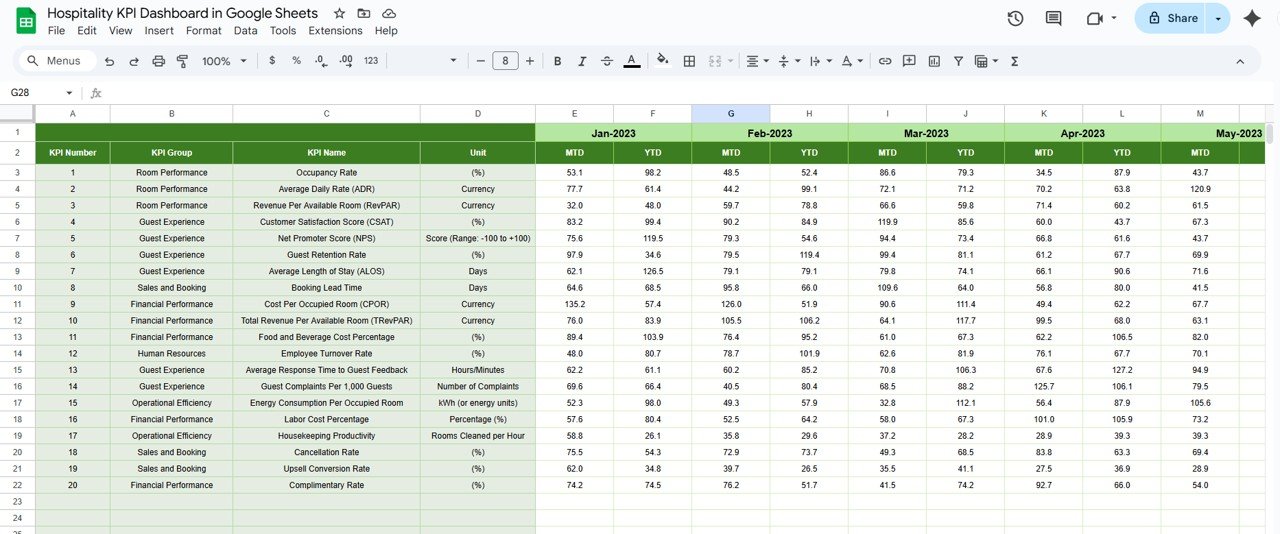
1. Dashboard Sheet Tab
This is the main tab where all key information is consolidated. The Dashboard Sheet Tab includes:
-
Month Selector: In Range D3, you can select the month using a dropdown. This will automatically adjust all the numbers on the dashboard based on the selected month.
-
KPIs Overview: The dashboard presents MTD (Month-to-Date) and YTD (Year-to-Date) actual performance, alongside target and previous year data.
-
Visual Indicators: Key performance indicators are displayed with conditional formatting (up and down arrows) for easy interpretation.

Click to buy Hospitality KPI Dashboard in Google Sheets
2. KPI Trend Sheet Tab
The KPI Trend Sheet provides a historical overview of each KPI’s performance. In this tab, you can:
-
Select the KPI Name: Choose any KPI from the dropdown in Range C3.
-
KPI Grouping: View the KPI’s group, unit, type, and whether it’s lower the better or upper the better.
-
Formula and Definition: This sheet also includes the formula used for aggregation and the KPI’s definition
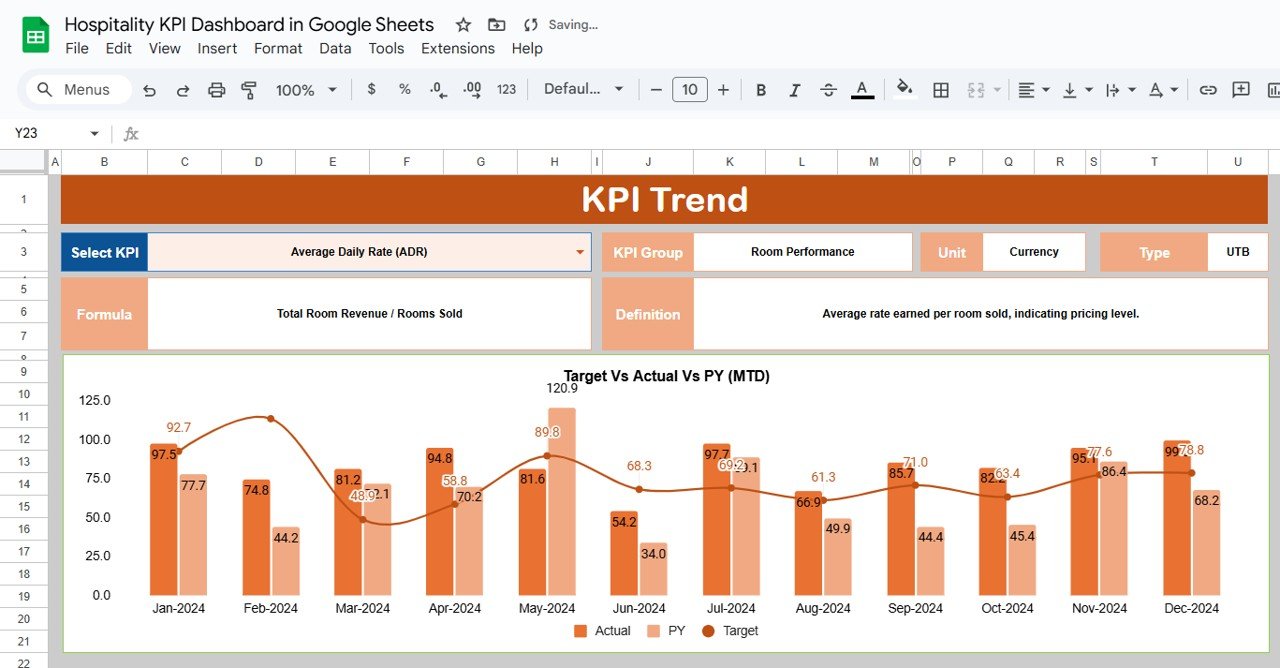
.Click to buy Hospitality KPI Dashboard in Google Sheets
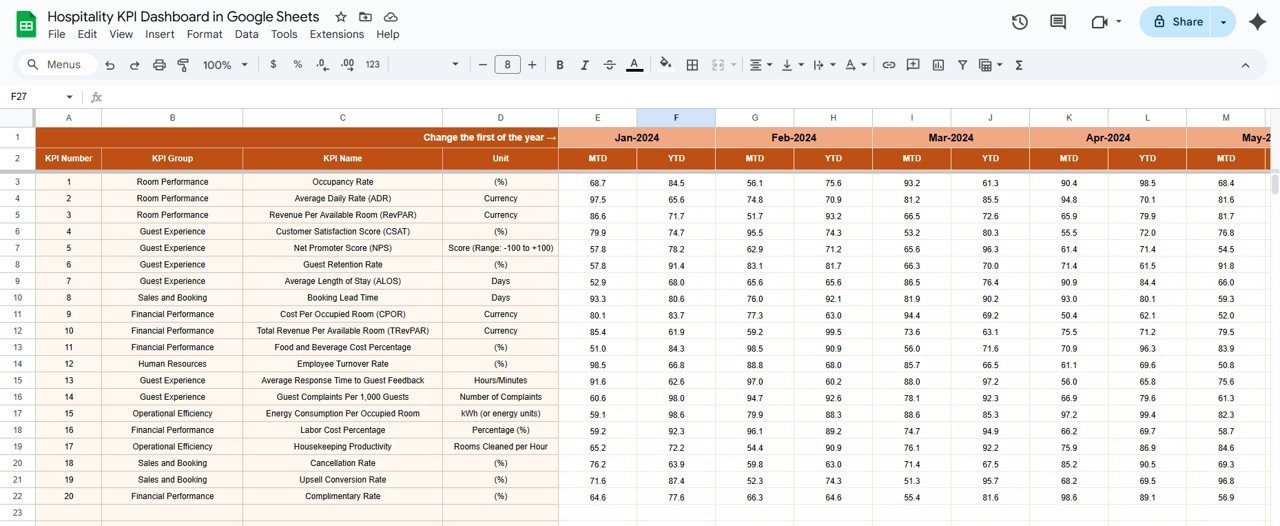
3. Actual Number Sheet Tab
This sheet allows you to input the actual numbers for both MTD and YTD. Each month, you can:
-
Update Actual Data: Enter the performance data for the current month and adjust the month in Range E1.
-
Track Current Month Data: This ensures that you are capturing up-to-date data for accurate performance tracking.
Click to buy Hospitality KPI Dashboard in Google Sheets
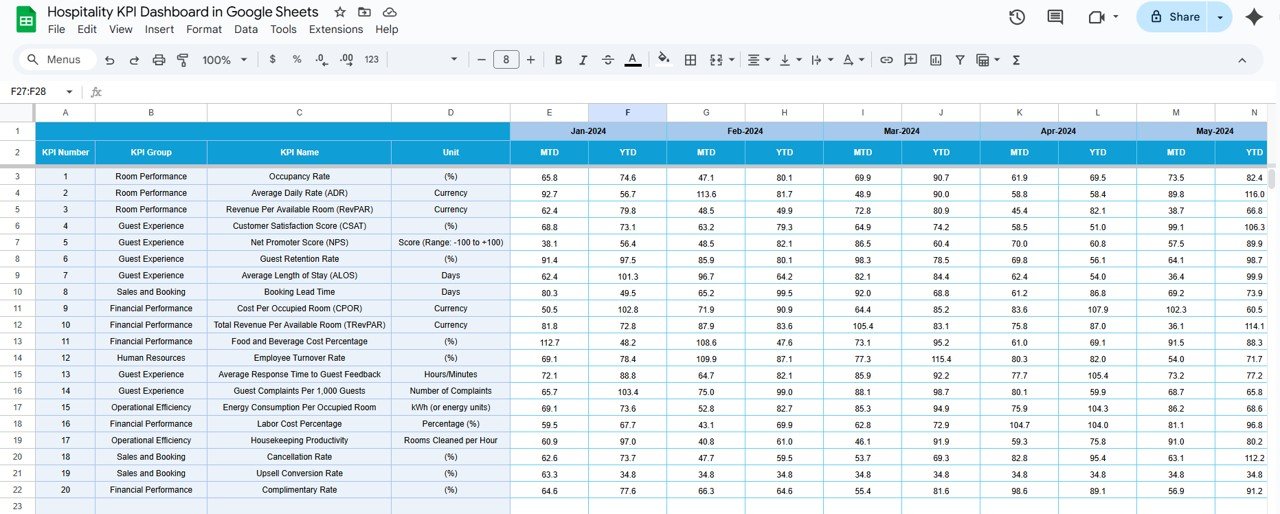
4. Target Sheet Tab
The Target Sheet is where you enter the target values for each KPI:
-
Monthly and Yearly Targets: Enter targets for each KPI in both MTD and YTD.
-
Tracking Performance Against Target: By comparing the actual performance against the targets, managers can gauge how well the business is performing and adjust strategies accordingly.
5. Previous Year Number Sheet Tab
This sheet allows you to input previous year’s data for each KPI. This historical data is essential for comparing year-over-year performance and identifying trends.
-
Consistency Check: By comparing current and past performance, the dashboard helps evaluate growth or declines in key metrics.
Click to buy Hospitality KPI Dashboard in Google Sheets
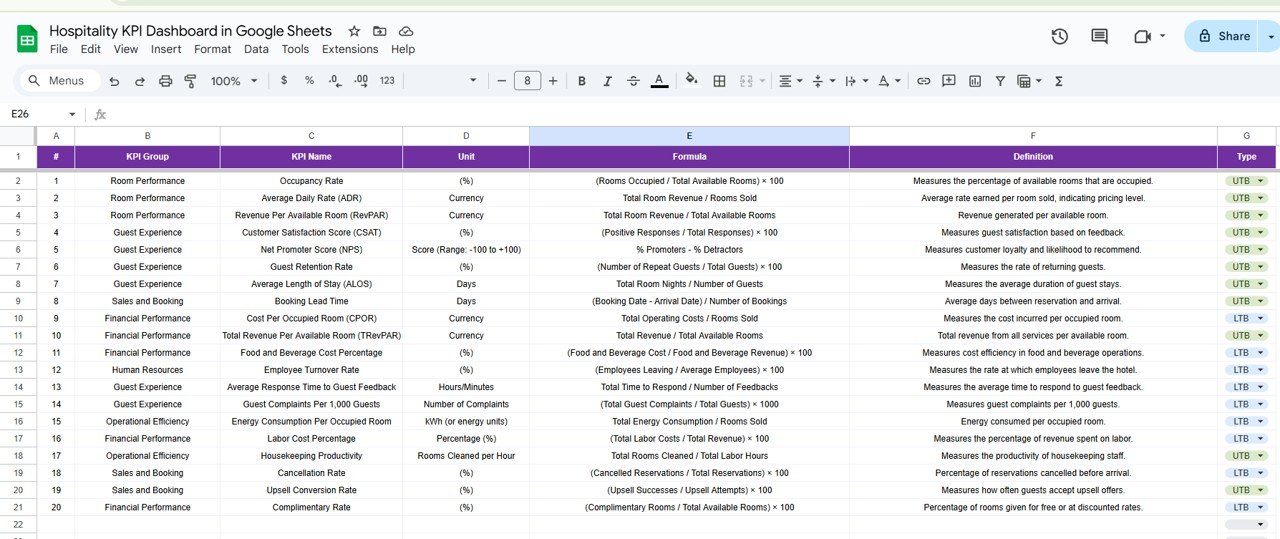
6. KPI Definition Sheet Tab
The KPI Definition Sheet is where you enter detailed information about each KPI:
-
Name and Group: Define each KPI’s name and its relevant group (e.g., financial, operational, customer satisfaction).
-
Unit and Formula: Specify the unit of measurement and formula for aggregation.
-
Clear Definitions: This sheet serves as a reference for understanding each KPI’s purpose and calculation method.
Best Practices for Using the Hospitality KPI Dashboard
To make the most out of your Hospitality KPI Dashboard in Google Sheets, consider following these best practices:
- Regular Data Updates: Ensure that your data is consistently updated. Monthly and yearly updates help track performance over time and provide actionable insights.
- Accurate Target Setting: Set realistic and achievable targets based on historical data and industry benchmarks. This ensures that your team has clear goals to work towards.
- Use Conditional Formatting: Utilize Google Sheets’ conditional formatting features to highlight trends in performance. This makes it easier to visualize areas where performance needs improvement.
- Customizable Dashboard: Adjust the dashboard according to your specific business needs. You can add or remove KPIs based on the services you offer (e.g., for a restaurant, you might include table turnover rate or meal satisfaction score).
- Regular Reviews: Make it a habit to review the dashboard regularly. This will allow you to respond quickly to emerging issues, make timely adjustments, and stay ahead of the competition.
Opportunities for Improvement in Hospitality KPI Dashboards
Click to buy Hospitality KPI Dashboard in Google Sheets
While Hospitality KPI Dashboards provide valuable insights, there is always room for improvement:
-
Data Integration: Consider integrating your dashboard with your property management system (PMS) or other data sources for automated data entry and real-time performance tracking.
-
Advanced Analytics: Incorporate predictive analytics and trend forecasting to anticipate future performance and adjust strategies accordingly.
-
User Training: Ensure all team members understand how to read and use the dashboard effectively. This enhances the impact of the KPIs on operational efficiency.
Frequently Asked Questions (FAQ)
1. What KPIs are most important for a hospitality business?
The most important KPIs include Occupancy Rate, Average Daily Rate (ADR), Revenue per Available Room (RevPAR), and Customer Satisfaction Score (CSAT).
2. Can I use Google Sheets for real-time tracking of hospitality KPIs?
Yes, Google Sheets allows for real-time collaboration, making it an excellent choice for tracking KPIs across multiple locations or teams.
3. How often should I update the data in the Hospitality KPI Dashboard?
It’s recommended to update the data monthly to ensure that you’re capturing the most up-to-date information for your business.
4. Can I customize the dashboard to include specific KPIs for my hospitality business?
Yes, the dashboard is highly customizable. You can add or remove KPIs based on the needs of your business.
5. What are the benefits of using a KPI Dashboard for hospitality businesses?
A KPI dashboard provides a centralized view of performance, allows for data-driven decision-making, and helps businesses quickly identify areas for improvement.
Conclusion
A Hospitality KPI Dashboard in Google Sheets is an invaluable tool for businesses looking to track and optimize their performance. By tracking essential KPIs, setting accurate targets, and reviewing data regularly, you can ensure your business stays competitive and continues to grow. Implementing best practices and exploring opportunities for improvement will only further enhance the effectiveness of your dashboard and drive success in the hospitality industry.
Visit our YouTube channel to learn step-by-step video tutorials