If you’re looking to analyze data in Google Sheets with precision and efficiency, you’ve come to the right place! In this blog post, we’re going to break down how to use the FILTER and LARGE functions together. By the end of this post, you’ll know exactly how to filter data based on top or bottom values effortlessly. Let’s dive right in!
Understanding the Scenario
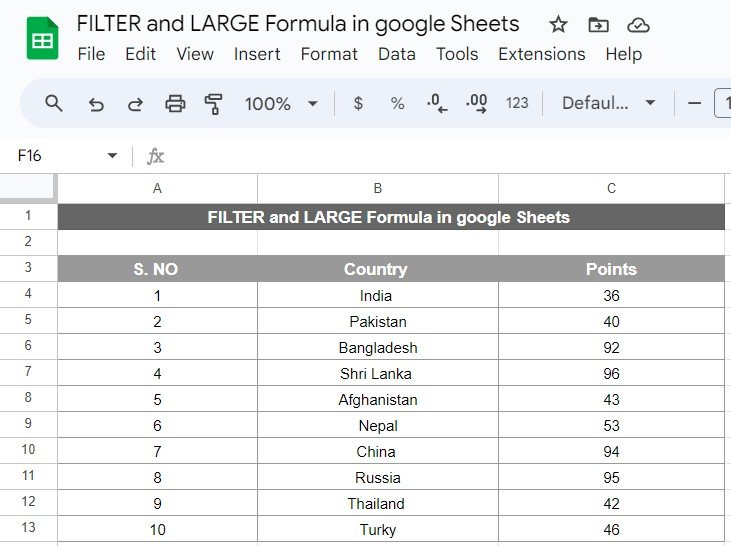
We have a set of data that includes countries and their respective points. Our goal is to filter out countries based on their points and identify specific rankings, such as the bottom three countries with the lowest scores. Sounds interesting? Let’s explore how you can achieve that using the FILTER and LARGE formulas.
Here’s the dataset we’ll be working with:
The Challenge: Finding the Bottom Three Countries by Points
In this example, we want to extract the bottom three countries with the lowest points. So, how do we do that? Using the LARGE function to determine the threshold and FILTER to narrow down the data to what’s important.
Step-by-Step Formula Breakdown
We’ll use the following formula to get the results:
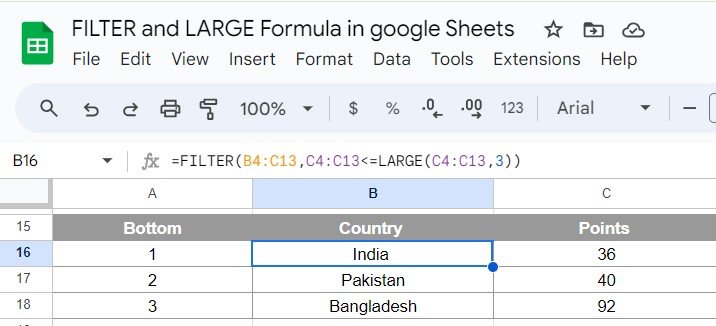
=FILTER(B4:C13, C4:C13 <= LARGE(C4:C13, 3))

Now, let’s break down what’s happening here:
FILTER(B4, C4<= LARGE(C4, 3)):
The FILTER function helps us filter out rows based on specific criteria.
LARGE(C4, 3) returns the third-largest number from the range of points (in this case, 92).
C4<= LARGE(C4, 3) checks if the points are less than or equal to the third-largest point. This ensures we capture the three lowest scores.
In simpler terms, this formula is finding the bottom three countries with points lower than or equal to 92.
The Result
After applying the formula, we get the following output:

Why Use FILTER and LARGE Together?
You might wonder why we’re combining these two formulas. Well, the LARGE function on its own helps you identify high-ranking or low-ranking values within a dataset, but the FILTER function lets you display those values in a more meaningful and organized way. Together, they allow for highly efficient data analysis, saving you time and making your results easy to interpret.
Conclusion:
Using the FILTER and LARGE functions together in Google Sheets opens up powerful possibilities for data analysis. Whether you’re working with large datasets or just trying to extract a few key insights, this combination is sure to make your tasks easier. Try it out on your own data and see how quickly you can get the information you need!
Visit our YouTube channel to learn step-by-step video tutorials
Youtube.com/@NeotechNavigators
Click here to Get this Template


