Managing and optimizing hydropower operations requires tracking various performance metrics to ensure efficient energy production and operational effectiveness. The Hydropower KPI Dashboard in Google Sheets is a powerful tool designed to track key performance indicators (KPIs) related to hydropower plants. With this dashboard, stakeholders can monitor critical metrics such as energy generation, efficiency, cost, and environmental impact, making it easier to make informed decisions.
In this article, we will explore the key features of the Hydropower KPI Dashboard, the KPIs it tracks, and how this tool can help optimize hydropower plant operations.
What is the Hydropower KPI Dashboard?
The Hydropower KPI Dashboard in Google Sheets is a ready-to-use template that provides a comprehensive view of the performance of hydropower plants. It tracks critical metrics to ensure that the plant is operating efficiently and meeting its targets. The dashboard allows users to track both current and historical performance, compare actual vs. target values, and analyze trends over time.
By using this dashboard, you can monitor key factors like energy production, system efficiency, maintenance costs, and overall plant performance, making it easier to identify areas that need improvement and take corrective action.
Key Features of the Hydropower KPI Dashboard in Google Sheets
The Hydropower KPI Dashboard consists of seven worksheets that allow you to track various KPIs in detail:
1. Dashboard Sheet Tab
The Dashboard Sheet serves as the main overview tab where all key KPIs are displayed:
-
Month Dropdown (D3): Select the desired month, and the entire dashboard will update with data for that specific period.
Key Metrics:
- MTD Actual, Target, Previous Year Data: View the actual performance for the current month and compare it with the target and previous year’s data.
- YTD Actual, Target, Previous Year Data: Track year-to-date performance and compare it with the target and last year’s data.
-
Conditional Formatting: Up and down arrows indicate whether each KPI is meeting or missing the target for both MTD and YTD data.

Click to buy Hydropower KPI Dashboard in Google Sheets
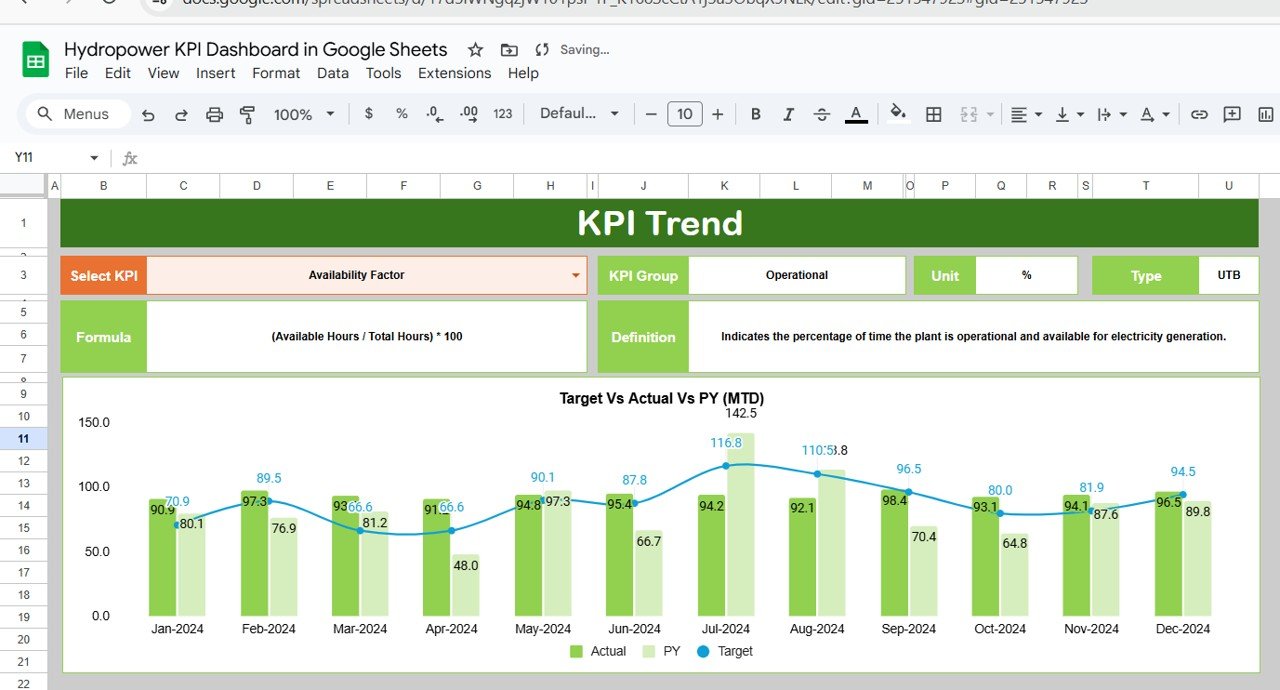
2. KPI Trend Sheet Tab
The KPI Trend Sheet allows you to track performance trends over time:
-
KPI Selection Dropdown (C3): Select a specific KPI, and the sheet will display its trend over the last few months.
-
KPI Group, Unit, Type: Displays the KPI’s group (e.g., energy generation, maintenance), its unit of measurement (e.g., megawatts, hours), and whether the KPI is “Lower the Better” (LTB) or “Upper the Better” (UTB).
-
Formula and Definition: Shows the formula used to calculate each KPI and provides a definition of what the KPI measures.
Click to buy Hydropower KPI Dashboard in Google Sheets
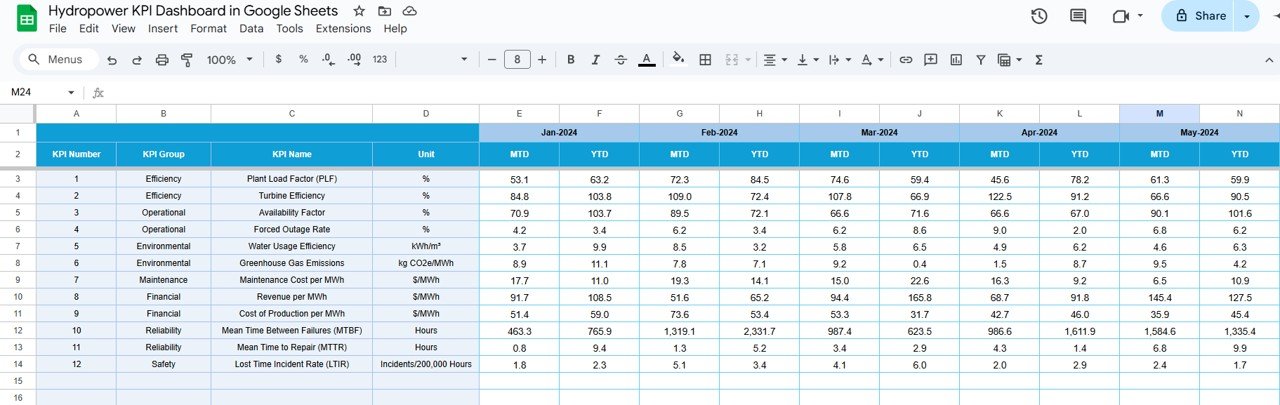
3. Actual Numbers Sheet Tab
In this sheet, you will input the actual performance data for each KPI:
-
MTD and YTD Data Input: Enter the actual values for each KPI, which will automatically update the dashboard.
-
Month Selection (E1): Select the first month of the year, and the data will update accordingly across the entire dashboard.
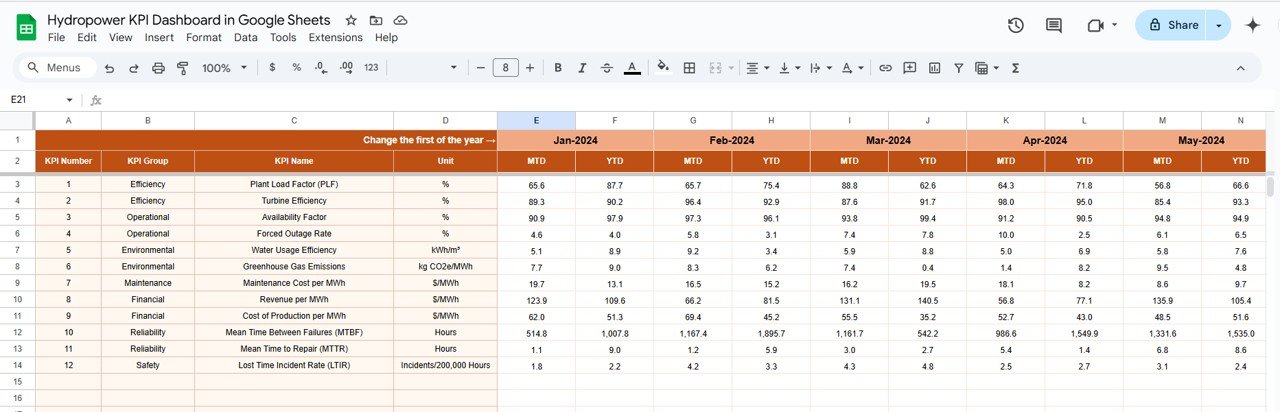
4. Target Sheet Tab
The Target Sheet allows you to input the target values for each KPI:
-
Monthly and YTD Targets: Enter the target numbers for each KPI for both MTD and YTD, which will be used to compare actual performance.
Click to buy Hydropower KPI Dashboard in Google Sheets
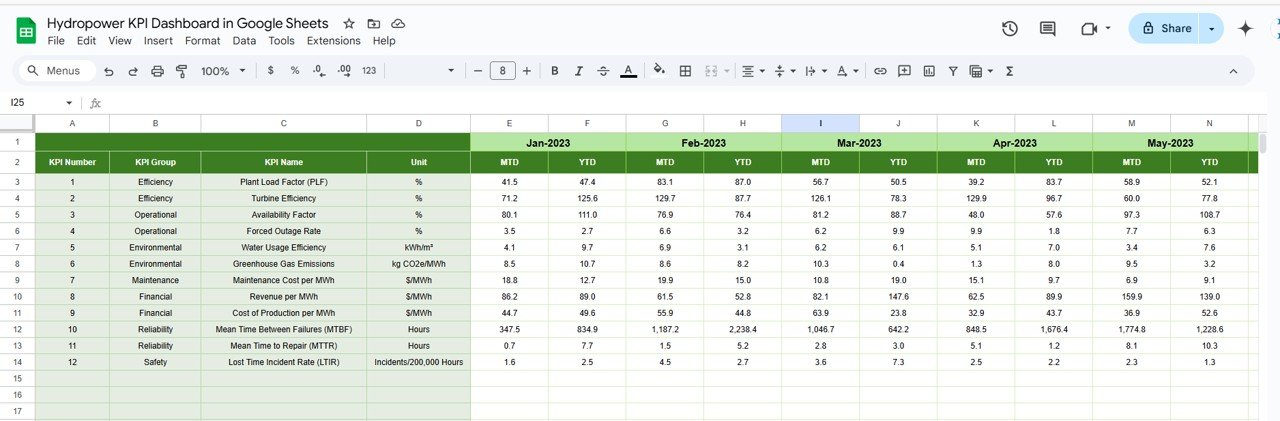
5. Previous Year Number Sheet Tab
This sheet stores the data for the previous year:
-
Historical Comparison: By entering last year’s data, you can compare current performance with historical figures to identify trends and assess progress.
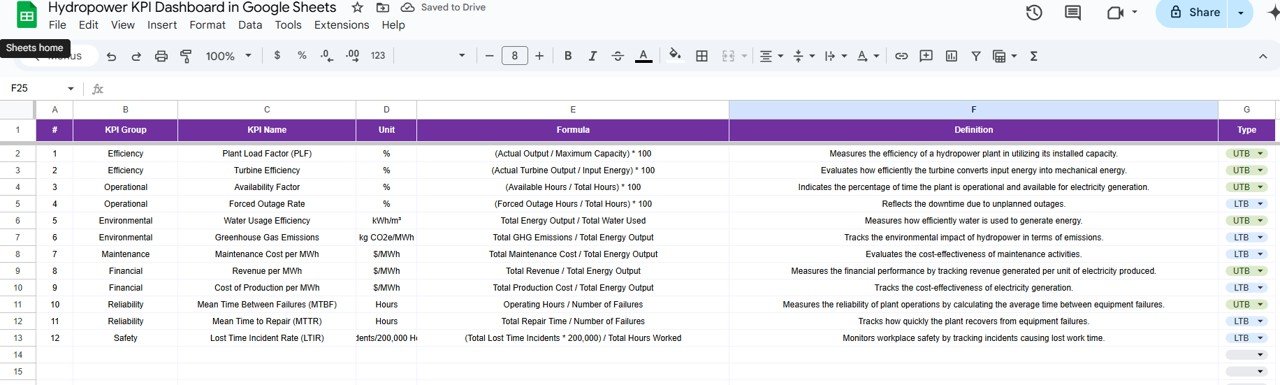
6. KPI Definition Sheet Tab
The KPI Definition Sheet provides a detailed explanation of each KPI:
-
KPI Name, Group, Unit: Defines each KPI’s name, group (e.g., energy production, maintenance), and unit of measurement.
-
Formula and Definition: Provides the formula for calculating each KPI and a clear explanation of its significance.
Click to buy Hydropower KPI Dashboard in Google Sheets
Advantages of Using the Hydropower KPI Dashboard
The Hydropower KPI Dashboard provides several key benefits:
-
Centralized Performance Tracking: All key KPIs related to hydropower performance are centralized, making it easy to monitor the overall plant performance.
-
Real-Time Monitoring: Track KPIs in real time to make quick adjustments and improvements to the plant’s operations.
-
Comparative Analysis: Easily compare actual performance with targets and historical data, allowing for data-driven decision-making.
-
Financial Insights: Track financial metrics such as Cost per MWh and Operational Cost per MWh to ensure the plant is operating efficiently.
-
Environmental Impact Tracking: Monitor the environmental benefits of your hydropower plant, including carbon offsets and energy efficiency.
Opportunity for Improvement in the Hydropower KPI Dashboard
While the Hydropower KPI Dashboard is a valuable tool, there are several opportunities for improvement:
-
Automation: Automating data entry from energy monitoring systems can reduce manual updates and ensure more accurate data.
-
Predictive Analytics: Integrating predictive analytics to forecast future energy production and efficiency would help with long-term planning.
-
Mobile Accessibility: Making the dashboard mobile-friendly would allow users to track performance from anywhere.
-
Advanced Reporting: Adding automated reporting features for monthly or quarterly summaries would save time and provide stakeholders with easy access to key information.
Best Practices for Using the Hydropower KPI Dashboard
Click to buy Hydropower KPI Dashboard in Google Sheets
To get the most out of the Hydropower KPI Dashboard, follow these best practices:
-
Regularly Update Data: Ensure that actual data is updated frequently to track progress and performance effectively.
-
Set Clear and Achievable Targets: Establish realistic targets for each KPI to drive plant optimization.
-
Review Trends Over Time: Regularly analyze trends and adjust operations based on performance metrics.
-
Collaborate with Stakeholders: Share the dashboard with team members, investors, and other stakeholders to align efforts and achieve performance goals.
-
Focus on High-Impact KPIs: Prioritize KPIs that have the greatest impact on energy production, efficiency, and cost management.
Conclusion
The Hydropower KPI Dashboard in Google Sheets is an essential tool for managing and optimizing the performance of hydropower plants. By tracking key performance indicators like energy generation, efficiency, and operational costs, this dashboard helps ensure that the plant is running efficiently and meeting its targets. The ability to track KPIs in real time, compare actual performance with targets, and analyze trends over time makes the dashboard an invaluable tool for anyone involved in hydropower plant management.
Frequently Asked Questions (FAQs)
1. What KPIs are tracked in the Hydropower KPI Dashboard?
The dashboard tracks KPIs like Total Energy Generated, Energy Efficiency, Cost per MWh, and more to measure the performance of the hydropower plant.
2. How do I update the Hydropower KPI Dashboard?
You can update the dashboard by entering actual performance data in the Actual Numbers Sheet and setting targets in the Target Sheet.
3. Can I customize the Hydropower KPI Dashboard?
Yes, the dashboard is fully customizable. You can add new KPIs, adjust formulas, and modify the layout to fit your needs.
4. How often should I update the data in the Hydropower KPI Dashboard?
It’s recommended to update the data regularly (e.g., weekly or monthly) to keep the dashboard accurate and up to date.
5. Can the Hydropower KPI Dashboard be automated?
Yes, you can integrate the dashboard with monitoring systems to automate data entry and ensure real-time updates.
Visit our YouTube channel to learn step-by-step video tutorials
Youtube.com/@NeotechNavigators
Watch the step-by-step video Demo:

