In the insurance industry, tracking key performance indicators (KPIs) is vital for evaluating business performance, identifying areas for improvement, and making informed decisions. The Insurance KPI Dashboard in Google Sheets is a powerful tool designed to help insurance companies monitor and track essential metrics for better decision-making.
In this article, we will explore the Insurance KPI Dashboard in Google Sheets, a ready-to-use template that helps insurance companies track key performance metrics efficiently. We will cover the KPIs, their definitions, formulas, and whether they should be “lower the better” or “upper the better.”
Key Features of the Insurance KPI Dashboard in Google Sheets
Below are the key features of this dashboard template:
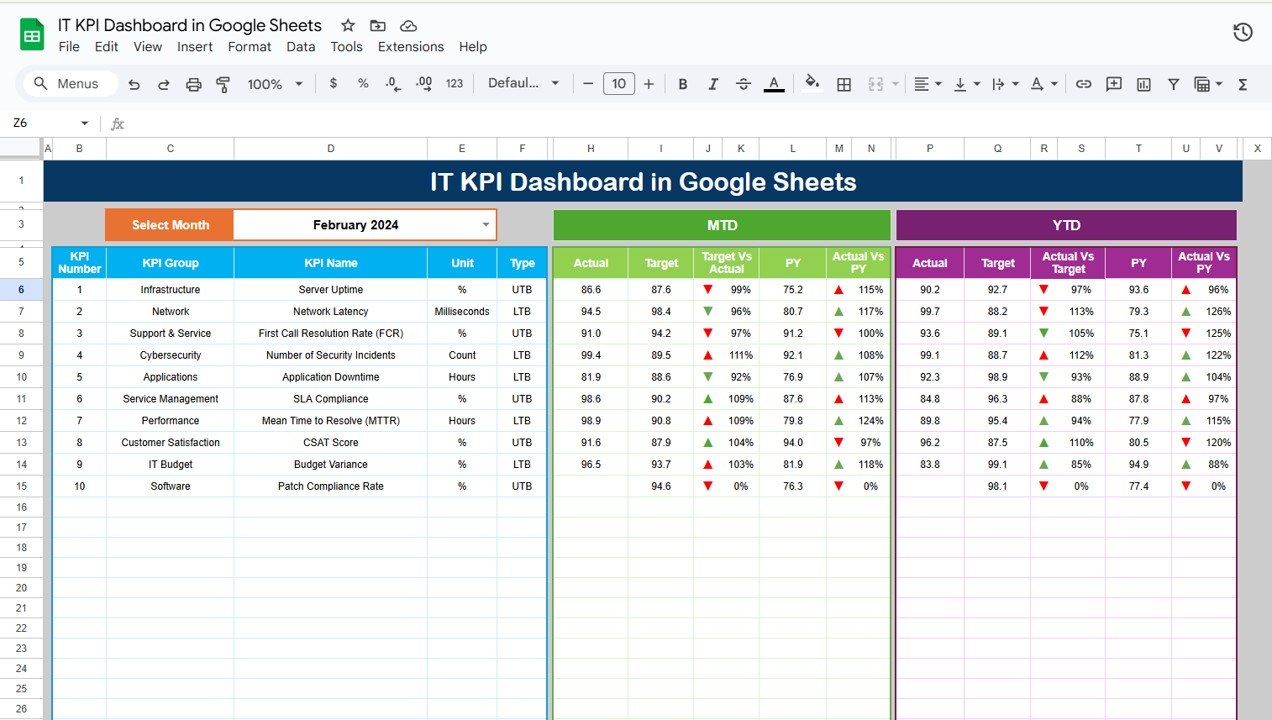
1. Dashboard Sheet Tab
This is the main sheet where all KPI information is displayed.
-
Month Selection: On Range D3, you can select the month from the drop-down menu, and the dashboard will update to reflect that month’s data.
-
MTD (Month-to-Date): Displays actual values, targets, and comparisons with previous year data using conditional formatting (up or down arrows).
-
YTD (Year-to-Date): Shows cumulative performance with comparisons to targets and previous year data.

2. KPI Trend Sheet Tab
-
Allows users to select KPIs from the drop-down in Range C3.
-
Displays the KPI group, unit of measure, type (Lower the Better or Upper the Better), formula, and KPI definition.

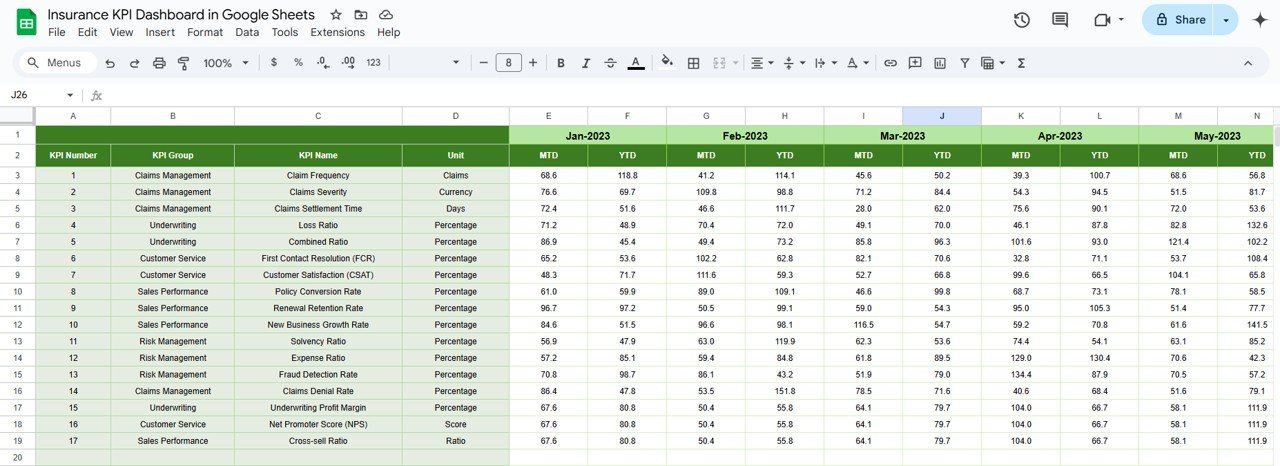
3. Actual Number Sheet Tab
-
Input actual numbers for both YTD and MTD for a given month.
-
The month selection is available in Range E1, where you input the first month of the year.

4. Target Sheet Tab
-
Enter target values for each KPI for MTD and YTD.
-
Helps track performance against the set goals.

5. Previous Year Number Sheet Tab
-
Enter the previous year’s data to enable accurate year-over-year comparisons.
-
Previous Year Number Sheet Tab
6. KPI Definition Sheet Tab
This sheet contains detailed information for each KPI, including:
- KPI Name
- KPI Group
- Unit of Measure
- Formula used to calculate the KPI
- Definition explaining the KPI

Advantages of Using the Insurance KPI Dashboard in Google Sheets
An Insurance KPI Dashboard in Google Sheets offers several benefits to insurance companies:
-
Real-Time Monitoring: Track KPIs in real-time, enabling quick decision-making and responsive management.
-
Customizable Templates: Google Sheets allows you to adjust the dashboard to suit your insurance company’s specific KPIs, goals, and data sources.
-
Cost-Effective: Google Sheets is free to use, making it an affordable option for insurance companies of all sizes.
-
Cloud-Based Collaboration: Multiple team members can collaborate in real-time, ensuring everyone is aligned and up-to-date on the KPIs.
-
Accessibility: The dashboard is accessible from any device with internet connectivity, enabling monitoring from anywhere.
Opportunities for Improvement in the Insurance KPI Dashboard
While the Insurance KPI Dashboard in Google Sheets is a valuable tool, there are opportunities for improvement:
Automating Data Entry:
- Current Challenge: Manual data entry can be time-consuming and prone to error.
- Opportunity: Integrating the dashboard with external systems (e.g., CRM, insurance management software) can automate data entry and improve accuracy.
Advanced Visualizations:
- Current Challenge: The dashboard currently provides basic visualizations.
- Opportunity: Adding advanced visualizations such as sparklines, pie charts, and heatmaps can provide more insightful data analysis.
Customizable Reporting:
- Current Challenge: Reporting features are basic.
- Opportunity: Expand reporting capabilities by adding customizable options like PDF exports or automated email summaries for stakeholders.
Best Practices for Using the Insurance KPI Dashboard
To get the most out of the Insurance KPI Dashboard in Google Sheets, consider these best practices:
-
Update Regularly: Ensure that data is updated at least monthly to keep the KPIs accurate and relevant.
-
Set Realistic Targets: Base your targets on historical data and industry benchmarks to ensure that goals are achievable.
-
Review Performance: Regularly review the KPIs to assess the performance of the insurance company and make necessary adjustments.
-
Encourage Collaboration: Share the dashboard with relevant team members to keep everyone aligned and informed.
-
Leverage Conditional Formatting: Use conditional formatting to provide instant visual cues for performance trends, such as color changes or up/down arrows.
Conclusion
The Insurance KPI Dashboard in Google Sheets is an essential tool for tracking key performance metrics in the insurance industry. By utilizing this dashboard, insurance companies can monitor operations efficiently, assess areas for improvement, and make informed decisions to drive growth and profitability.
Frequently Asked Questions (FAQs)
What is a KPI in the insurance industry?
A KPI (Key Performance Indicator) is a measurable value that indicates how effectively an insurance company is achieving its objectives. Common KPIs include claims ratio, loss ratio, and customer satisfaction.
How do I customize my Insurance KPI Dashboard?
You can easily customize the dashboard by adding or removing KPIs, adjusting formulas, and changing data sources to match your company’s unique needs.
How do I enter data into the Insurance KPI Dashboard?
Enter data for KPIs such as actual numbers and targets into the appropriate sheets (Actual Numbers Sheet, Target Sheet, Previous Year Numbers Sheet) for each month.
Can I automate the data entry process?
Yes, you can integrate the dashboard with other systems like CRM or insurance management software to automate data entry and reduce manual input errors.
Which KPIs should I track in my insurance company?
Essential KPIs for insurance companies include claims ratio, loss ratio, expense ratio, retention rate, and customer satisfaction.
Visit our YouTube channel to learn step-by-step video tutorials
Youtube.com/@NeotechNavigators