Investment management requires continuous monitoring, accurate performance measurement, and data-driven decision-making. Investment firms, portfolio managers, and financial analysts must evaluate multiple performance indicators regularly to ensure portfolios achieve expected returns while managing risks effectively. However, many organizations still rely on manual spreadsheets that make analysis slow and inconsistent.
Therefore, professionals increasingly use automated KPI scorecards that simplify performance monitoring. One powerful solution is the Investment Management KPI Scorecard in Google Sheets, a ready-to-use template designed to track investment performance using structured Key Performance Indicators (KPIs).
In this article, we will explain the Investment Management KPI Scorecard in Google Sheets, including its features, structure, KPIs, advantages, best practices, and implementation approach.
What Is an Investment Management KPI Scorecard in Google Sheets?
Click to Buy Investment Management KPI Scorecard In Google Sheets
An Investment Management KPI Scorecard in Google Sheets is an interactive performance monitoring tool that evaluates investment outcomes using predefined KPIs and automated calculations.
Instead of reviewing multiple financial reports, users analyze investment performance through a centralized scorecard. Moreover, the dashboard updates automatically when users select a specific month, allowing both monthly and yearly performance tracking.
This scorecard helps organizations:
- Monitor investment performance efficiently
- Compare monthly and yearly results
- Track KPI trends visually
- Evaluate portfolio efficiency
- Identify performance improvements
- Support strategic investment decisions
Consequently, financial professionals gain clear visibility into portfolio performance.
Why Do Investment Managers Need a KPI Scorecard?
Investment environments change quickly due to market volatility, economic shifts, and risk factors. Without structured monitoring, performance evaluation becomes difficult.
Common Challenges Without KPI Tracking
- Manual financial reporting
- Delayed performance evaluation
- Difficulty comparing periods
- Lack of standardized KPIs
- Limited trend visibility
- Inconsistent decision-making
Therefore, organizations require a structured KPI scorecard to monitor performance consistently.
Key Features of Investment Management KPI Scorecard in Google Sheets
Click to Buy Investment Management KPI Scorecard In Google Sheets
This scorecard provides automated KPI tracking with interactive performance visualization.
Major Features
- Ready-to-use Google Sheets template
- Month selection dropdown for dynamic reporting
- Automatic KPI updates
- Traffic light performance indicators
- Up and down arrows showing percentage change
- MTD and YTD performance views
- KPI trend monitoring
- Centralized KPI definitions
- Customizable color settings
Because calculations update automatically, users analyze performance instantly.
Dashboard Navigation and Worksheet Structure
The scorecard contains structured worksheet tabs that organize data and analysis.
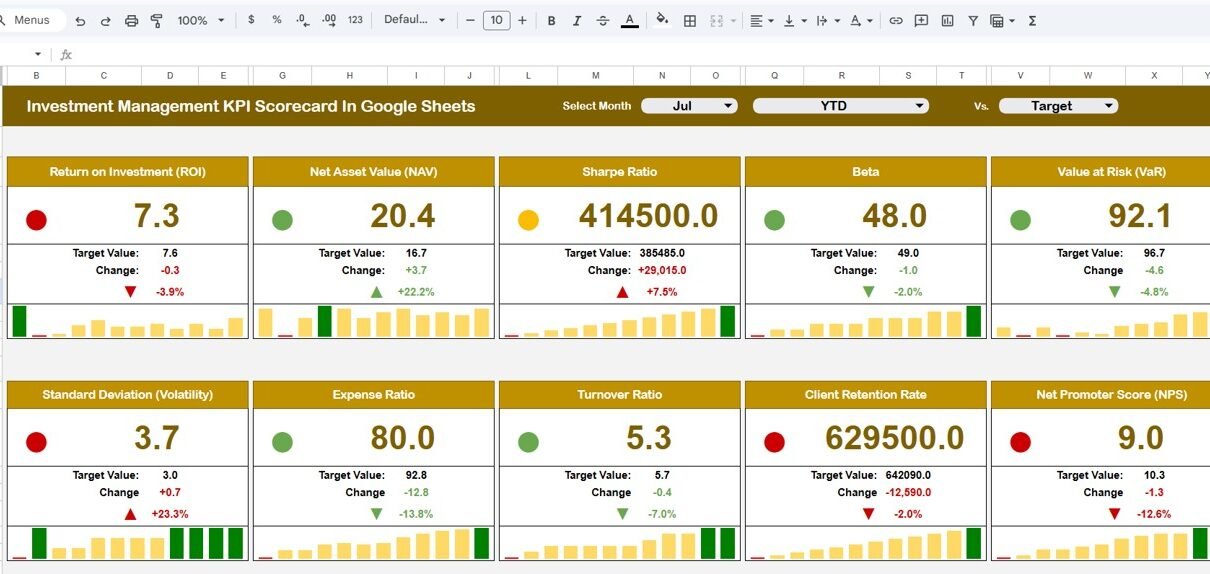
1. Scorecard Dashboard Sheet
This is the main performance page.
Features Available
- Month dropdown selection
- KPI performance summary
- Traffic light indicators
- Percentage change arrows
- MTD and YTD toggle buttons
Traffic light colors represent performance:
- 🟢 Green → Good performance
- 🟡 Amber → Moderate performance
- 🔴 Red → Needs improvement
Because visuals update instantly, decision-making becomes faster.

Click to Buy Investment Management KPI Scorecard In Google Sheets
2. Trend Sheet Tab – KPI Performance Movement
The Trend Sheet helps analyze KPI behavior over time.
Available Information (Dropdown in Range C3)
- KPI Group
- KPI Unit
- KPI Type (Lower or Upper Better)
- KPI Formula
- KPI Definition
- Trend visualization
Users understand how each KPI evolves month by month.

Click to Buy Investment Management KPI Scorecard In Google Sheets
3. KPI Definition Sheet Tab – KPI Master Data
This sheet acts as the KPI reference database.
Information Stored
- KPI Name
- KPI Group
- KPI Unit
- KPI Formula
- KPI Definition
Because KPI logic remains centralized, reporting stays standardized.

Click to Buy Investment Management KPI Scorecard In Google Sheets
4. Data Input Sheet Tab – Performance Data Entry
This sheet allows users to input investment performance data.
Data Entry Process
- Enter KPI values monthly
- Update investment performance numbers
- Dashboard updates automatically
Proper data entry ensures accurate analytics.

Click to Buy Investment Management KPI Scorecard In Google Sheets
5. Colour Settings Sheet – Visual Customization
This sheet controls dashboard appearance.
Customization Options
- Traffic light colors
- Performance thresholds
- Arrow formatting rules
Organizations can align visuals with branding standards.

Click to Buy Investment Management KPI Scorecard In Google Sheets
Advantages of Investment Management KPI Scorecard in Google Sheets
Centralized Investment Monitoring
All KPIs appear in one structured scorecard.
Real-Time Performance Analysis
Users track performance instantly.
Better Decision-Making
Visual indicators simplify analysis.
Monthly and Yearly Tracking
MTD and YTD views provide flexibility.
Easy Customization
Users modify KPIs easily.
Cloud-Based Collaboration
Teams work together in real time.
Cost-Effective Solution
No expensive financial software required.
Best Practices for Using the Investment KPI Scorecard
Click to Buy Investment Management KPI Scorecard In Google Sheets
1. Define KPIs Clearly
Ensure KPIs align with investment objectives.
2. Update Data Regularly
Maintain consistent monthly updates.
3. Monitor Trends Frequently
Review KPI movements regularly.
4. Use Traffic Indicators Properly
Set realistic performance thresholds.
5. Compare Benchmark Performance
Evaluate against market standards.
6. Maintain Data Accuracy
Validate financial inputs carefully.
7. Conduct Monthly Reviews
Discuss performance insights with stakeholders.
Conclusion
Click to Buy Investment Management KPI Scorecard In Google Sheets
The Investment Management KPI Scorecard in Google Sheets provides a structured and intelligent way to monitor investment performance. Instead of relying on manual analysis, organizations gain automated insights through dynamic KPIs, traffic indicators, and trend analysis.
Because the scorecard combines automation, visualization, and flexibility, investment managers make faster and smarter decisions. Moreover, the ability to switch between monthly and yearly views ensures complete performance visibility.
In today’s data-driven financial environment, organizations that adopt KPI scorecards achieve stronger portfolio control and improved investment outcomes.
Frequently Asked Questions (FAQs)
What is an Investment Management KPI Scorecard?
It is a performance tracking tool that evaluates investments using measurable KPIs.
Can beginners use this template?
Yes. The template uses simple Google Sheets functionality.
What is MTD and YTD?
MTD shows monthly performance, while YTD shows cumulative yearly performance.
Can KPIs be customized?
Yes. Users can edit KPIs in the KPI Definition sheet.
Does the scorecard update automatically?
Yes. Selecting a month updates all KPIs instantly.
Who should use this scorecard?
Portfolio managers, investment analysts, and financial planners.
Does it support multiple portfolios?
Yes. Users can track multiple investment datasets.
Visit our YouTube channel to learn step-by-step video tutorials
Youtube.com/@NeotechNavigators
Watch the step-by-step video tutorial:
Click to Buy Investment Management KPI Scorecard In Google Sheets