In today’s data-driven business environment, IT performance is one of the biggest factors that influence overall organizational efficiency. The IT KPI Scorecard in Google Sheets provides an intuitive and ready-to-use solution for IT managers to track key performance indicators (KPIs), visualize progress, and make informed decisions.
This scorecard helps you measure monthly and yearly IT performance with color-coded visuals, percentage changes, and dynamic charts — all in a single Google Sheets file.
What Is an IT KPI Scorecard?
An IT KPI Scorecard is a management tool that tracks the efficiency, reliability, and productivity of IT operations. It consolidates all important IT metrics such as uptime, response time, incidents resolved, and budget utilization into a single dashboard.
The Google Sheets version of the scorecard is ideal for IT departments because it’s easy to use, collaborative, and customizable.
Key Features of the IT KPI Scorecard in Google Sheets
Click to Buy IT KPI Scorecard in Google Sheets
The template consists of multiple tabs that work together to make IT performance tracking simple and visual.
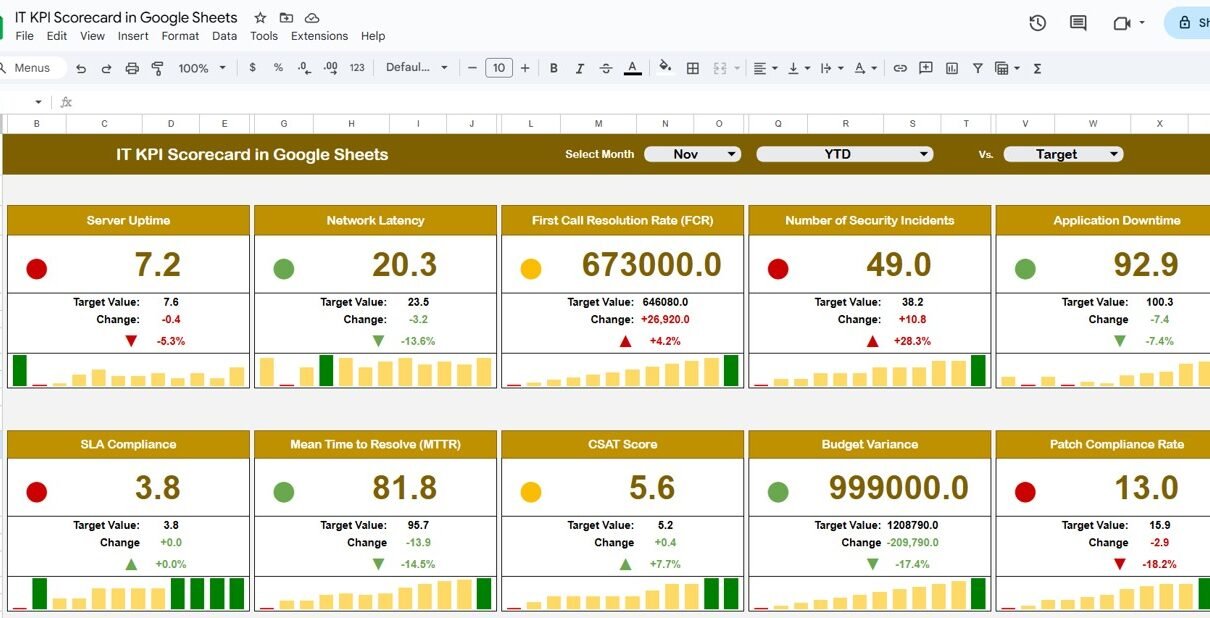
1. Scorecard Sheet Tab
This is the main dashboard where all key IT KPIs are displayed.
Key Features:
-
Month Dropdown (Cell D3): Select any month, and the data automatically updates.
-
Dynamic Indicators: See instant visual feedback with traffic light colors (Red, Yellow, Green) and up/down arrows.
-
MTD vs YTD Toggle: Easily switch between Month-to-Date (MTD) and Year-to-Date (YTD) performance views.
-
Performance Metrics: Displays Actual, Target, and Previous Year data for each KPI, with percentage comparisons.
This allows IT managers to instantly assess progress, spot underperforming areas, and take corrective actions.

Click to Buy IT KPI Scorecard in Google Sheets
2. KPI Trend Sheet Tab
The KPI Trend Sheet provides detailed insights into each KPI.
Key Features:
-
Select KPI Name from the dropdown (Cell C3) to view detailed trends.
-
Displays KPI Group, Unit, Formula, and Performance Type (UTB – Upper the Better, LTB – Lower the Better).
-
Trend Charts show MTD and YTD comparisons against targets and previous year values.
This helps in understanding whether performance improvements are consistent or fluctuating.

3. KPI Definition Sheet Tab
This tab is a reference sheet that defines each KPI clearly.
Columns Included:
-
KPI Name
-
KPI Group
-
Unit (e.g., %, count, hours)
-
Formula (how it’s calculated)
-
Definition (explains what the KPI measures)
-
Type (UTB – Upper the Better, LTB – Lower the Better)
This ensures standardization and transparency across all team members.

Click to Buy IT KPI Scorecard in Google Sheets
4. Data Input Sheet Tab
This sheet is the data entry section for monthly inputs.
How to Use:
-
Enter actual performance values for each KPI by month.
-
Input Target and Previous Year data for easy comparison.
-
The dashboard updates automatically based on this data.
This structure keeps data organized and ensures accuracy in the visual analysis.

5. Color Settings Tab
This optional sheet controls color coding and thresholds for performance indicators.
-
Adjust conditional formatting thresholds for Red (Below Target), Yellow (Near Target), and Green (Above Target).
-
Customize icons for up/down arrows based on performance trends.
This feature makes the dashboard visually appealing and easy to interpret.

Click to Buy IT KPI Scorecard in Google Sheets
Advantages of Using the IT KPI Scorecard
-
Real-Time Analysis: Instantly view performance updates as new data is entered.
-
Visual Insights: Quickly identify strengths and weaknesses using charts and colors.
-
Data Consistency: Centralized KPI definitions eliminate confusion.
-
Strategic Decision-Making: Focus resources where improvement is needed.
-
Flexible Usage: Track MTD and YTD performance with a single click.
-
Collaborative Tool: Google Sheets allows multiple users to work simultaneously.
Best Practices for Using the IT KPI Scorecard
Click to Buy IT KPI Scorecard in Google Sheets
-
Update Monthly Data Consistently: Keep your scorecard accurate and up-to-date.
-
Review KPI Definitions Regularly: Ensure they align with business goals.
-
Leverage Conditional Formatting: Use visual cues for faster decision-making.
-
Integrate with Other Tools: Combine data from CRM, service desks, or project tools for better accuracy.
-
Focus on Trends, Not Just Values: Use the KPI Trend tab to monitor performance stability.
Frequently Asked Questions (FAQs)
Q1: Can I add more KPIs to the scorecard?
Yes, you can add or modify KPIs in the KPI Definition and Data Input sheets easily.
Q2: How do I switch between MTD and YTD views?
Simply click the “MTD” or “YTD” button on the main dashboard to toggle the data.
Q3: Can I change the colors of traffic lights and arrows?
Yes, the Color Settings tab allows you to customize visual indicators.
Q4: Is this dashboard suitable for large IT teams?
Absolutely. It can handle multiple KPIs and can be shared across departments.
Q5: Can I track performance for multiple months or years?
Yes, just input data month-wise, and the dashboard automatically updates based on your selection.
Conclusion
Click to Buy IT KPI Scorecard in Google Sheets
The IT KPI Scorecard in Google Sheets is a powerful and efficient tool for tracking IT department performance. With dynamic indicators, trend analysis, and easy customization, it simplifies KPI monitoring and supports strategic decision-making. Whether you’re managing infrastructure, security, or support teams, this dashboard helps you stay informed, efficient, and proactive.
Visit our YouTube channel to learn step-by-step video tutorials
Youtube.com/@NeotechNavigators
Watch the step-by-step video Demo: