Learning & Development (L&D) plays a critical role in employee growth, workplace productivity, and organizational success. But without proper tracking, it becomes difficult to monitor training performance, budget utilization, trainer efficiency, and departmental training outcomes.Learning & Development Performance Dashboard in Google Sheets
The Learning & Development Performance Dashboard in Google Sheets is a ready-to-use dashboard designed to help HR and L&D teams track training programs, analyze budgets, measure performance, and evaluate training effectiveness—all in one place.Learning & Development Performance Dashboard in Google Sheets
This article explains the dashboard structure, features, benefits, and opportunities for improvement, along with frequently asked questions.Learning & Development Performance Dashboard in Google Sheets
What Is the Learning & Development Performance Dashboard?
Click to Buy Learning & Development Performance Dashboard in Google Sheets
The L&D Performance Dashboard is an analytic tool built in Google Sheets that gives organizations real-time insights into:Learning & Development Performance Dashboard in Google Sheets
-
Training completion
-
Budget allocation vs utilization
-
Overspending patterns
-
Department-level training performance
-
Trainer effectiveness
-
Program-wise insights
-
Training duration and outcomes
It simplifies decision-making by presenting complex data in clean, visual charts.
Why Use Google Sheets for L&D Performance Tracking?
Google Sheets is ideal because it offers:Learning & Development Performance Dashboard in Google Sheets
-
Real-time data updates
-
Easy collaboration across HR & L&D teams
-
Built-in charts & formulas
-
Cloud access from anywhere
-
Zero software cost
-
Full customization flexibility
This dashboard is perfect for small teams, large enterprises, and remote HR functions.
Dashboard Structure and Features
Click to Buy Learning & Development Performance Dashboard in Google Sheets
The dashboard contains multiple sheet tabs designed for complete L&D analysis.
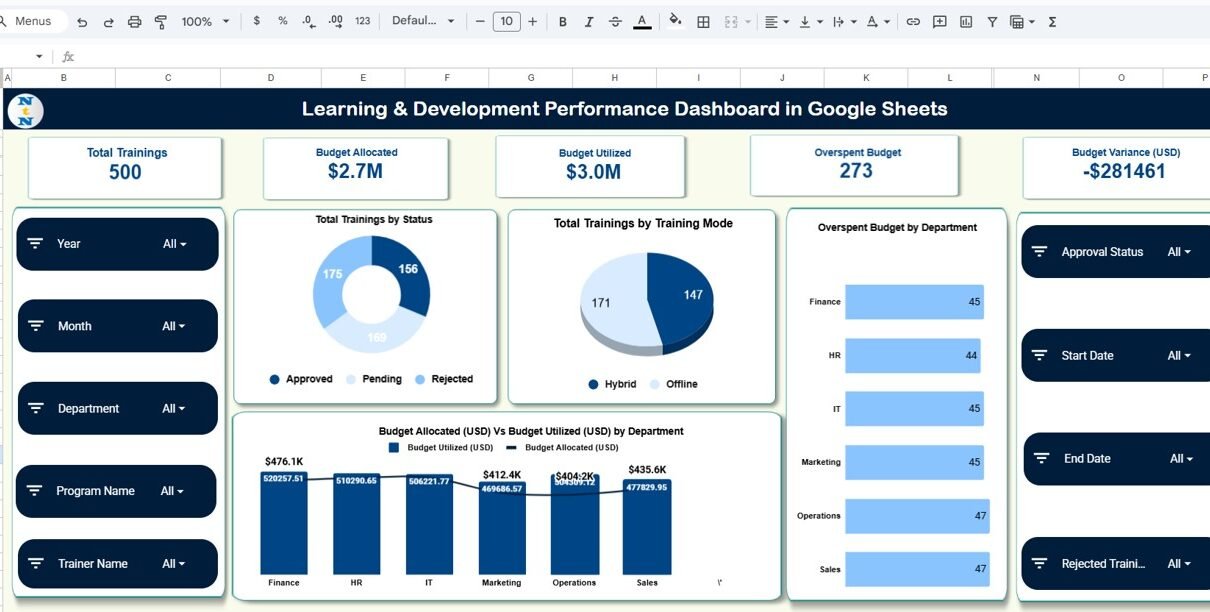
1. Overview Sheet Tab
This is the main dashboard showcasing top-level L&D KPIs.
Card Metrics Include:
-
Total Trainings – Total number of training programs conducted
-
Budget Allocated – Total L&D budget assigned
-
Budget Utilized – Actual spending on training programs
-
Overspent Budget – Amount exceeded beyond the allocated budget
-
Budget Variance (USD) – Difference between allocated and utilized budgets
Charts Included:
-
Total Trainings by Status – Completed, ongoing, planned, cancelled
-
Total Trainings by Training Mode – Online, offline, hybrid, workshop, etc.
-
Overspent Budget by Department – Helps identify budget overuse
-
Budget Allocated vs Budget Utilized by Department – Reveals financial efficiency across departments

Click to Buy Learning & Development Performance Dashboard in Google Sheets
2. Trainer Analysis
This sheet focuses on trainer-specific performance.
Charts Included:
-
Total Programs by Trainer Name
-
Budget Utilized (USD) by Trainer Name
-
Approved, Pending & Rejected Training by Trainer
This helps L&D teams compare trainer performance and training approval efficiency.

3. Department Analysis
This section shows department-wise training performance.
Charts Included:
-
Budget Variance (USD) by Department
-
Total Trainings by Department
-
Budget Utilized (USD) by Department
-
Average Training Duration (Days) by Department
This helps HR identify which departments invest more in training and which require improvements.

Click to Buy Learning & Development Performance Dashboard in Google Sheets
4. Program Analysis
A deeper look into individual training programs.
Charts Included:
-
Budget Variance (USD) by Program Name
-
Total Trainings by Program Name
-
Average Training Duration (Days) by Program Name
-
Budget Utilized (USD) by Program Name
Programs with high cost or low output become instantly visible.

Click to Buy Learning & Development Performance Dashboard in Google Sheets
5. Search Sheet Tab
Allows quick lookup of training records based on:
- Training name
- Department
- Trainer
- Status
- Program name
- Training mode
- Any keyword
Saves time when working with large datasets.
6. Data Sheet Tab
This sheet stores all raw data such as:
- Training ID
- Training Name
- Department
- Trainer
- Mode
- Duration
- Status
- Budget allocated
- Budget utilized
- Program name
- Training dates
All charts and KPIs pull data from this sheet.

Click to Buy Learning & Development Performance Dashboard in Google Sheets
Advantages of Using the L&D Performance Dashboard
-
Complete L&D visibility – All training KPIs in one place
-
Budget insights – Avoid overspending and track variance
-
Trainer-level evaluation – Identify top-performing trainers
-
Department-level analysis – Understand training distribution
-
Program performance insights – Improve ineffective programs
-
Improved decision-making – Helps management plan future training
-
Fully cloud-based – Accessible anywhere, anytime
-
Easy to customize – Add new KPI or training categories anytime
Opportunities for Improvement
You can enhance this tracker with:
-
Training effectiveness scoring
-
Employee feedback integration
-
Automated training reminders
-
Certificate tracking
-
HRIS integration using Google Apps Script
-
Dynamic training cost forecasting
Best Practices for Using the Dashboard
Click to Buy Learning & Development Performance Dashboard in Google Sheets
-
Update data consistently – Maintain accurate training records
-
Use standard training categories – Ensures clean reporting
-
Review dashboard monthly – Track budget and performance trends
-
Compare training spending across departments
-
Prioritize high-value or high-impact programs
-
Use insights to plan yearly L&D strategy
Conclusion
The Learning & Development Performance Dashboard in Google Sheets gives HR and L&D teams a powerful way to evaluate training efforts, budget usage, trainer outcomes, and program performance.
With automated charts, KPI cards, and easy search features, this dashboard delivers clear insights for better decision-making and improved employee development.Learning & Development Performance Dashboard in Google Sheets
Use this tool to build smarter, more efficient learning programs and strengthen overall organizational performance.Learning & Development Performance Dashboard in Google Sheets
Frequently Asked Questions (FAQs)
Click to Buy Learning & Development Performance Dashboard in Google Sheets
1. What KPIs does the dashboard track?
Training count, budget allocated/utilized, budget variance, trainer performance, program & department analysis.
2. Can I customize departments or training programs?
Yes, the dashboard is fully customizable.
3. Does the dashboard calculate overspending automatically?
Yes, it highlights overspent budget and variance dynamically.
4. Is this dashboard suitable for large organizations?
Yes, it works for teams of any size.
5. Can multiple HR users collaborate?
Yes, Google Sheets supports real-time collaboration.
Visit our YouTube channel to learn step-by-step video tutorials
Youtube.com/@NeotechNavigators
Click to Buy Learning & Development Performance Dashboard in Google Sheets