The Logistics Efficiency KPI Dashboard in Google Sheets is a dynamic and ready-to-use tool that helps businesses track and improve their logistics performance. This dashboard allows logistics teams and managers to monitor key performance indicators (KPIs) in real time, ensuring that operations run efficiently and costs are kept under control.
In this article, we will explore the key features of the Logistics Efficiency KPI Dashboard and provide an overview of the KPIs it tracks, their formulas, definitions, and the type of KPI (whether Lower the Better or Upper the Better).
Key Features of the Logistics Efficiency KPI Dashboard in Google Sheets
The Logistics Efficiency KPI Dashboard consists of multiple sheets, each serving a unique function to help track and analyze logistics operations. Below is an overview of the worksheets and their respective functionalities:
1. Dashboard Sheet Tab
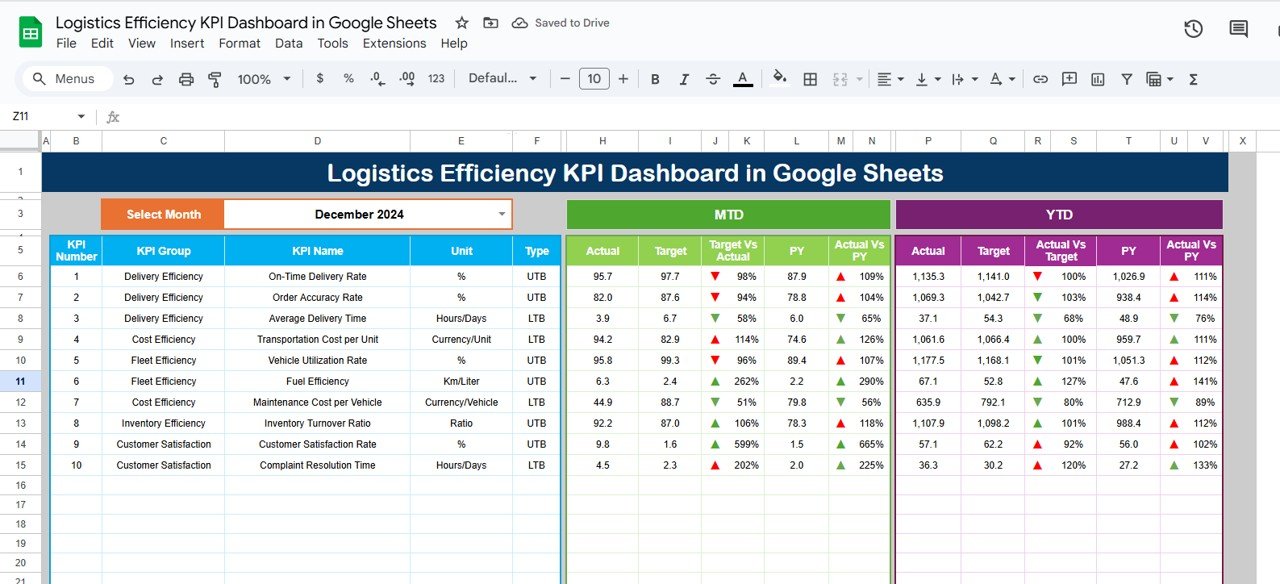
The Dashboard Sheet Tab is the central hub of the KPI dashboard. It displays all the KPIs and key data for logistics efficiency. Features include:
-
MTD (Month-to-Date) Actual: Displays the actual values for the current month.
-
Target: Shows the target values for each KPI for the month.
-
Previous Year Data (PY): Compares the current month’s data with the previous year’s figures.
-
Target vs. Actual: Shows how actual performance compares to the target.
-
PY vs. Actual: Compares the current year’s performance with the previous year, with conditional formatting (up/down arrows) to indicate performance trends.
You can select the month from the drop-down list in Range D3, and the dashboard will automatically update to reflect the data for that month.
Click to buy Logistics Efficiency KPI Dashboard in Google Sheets
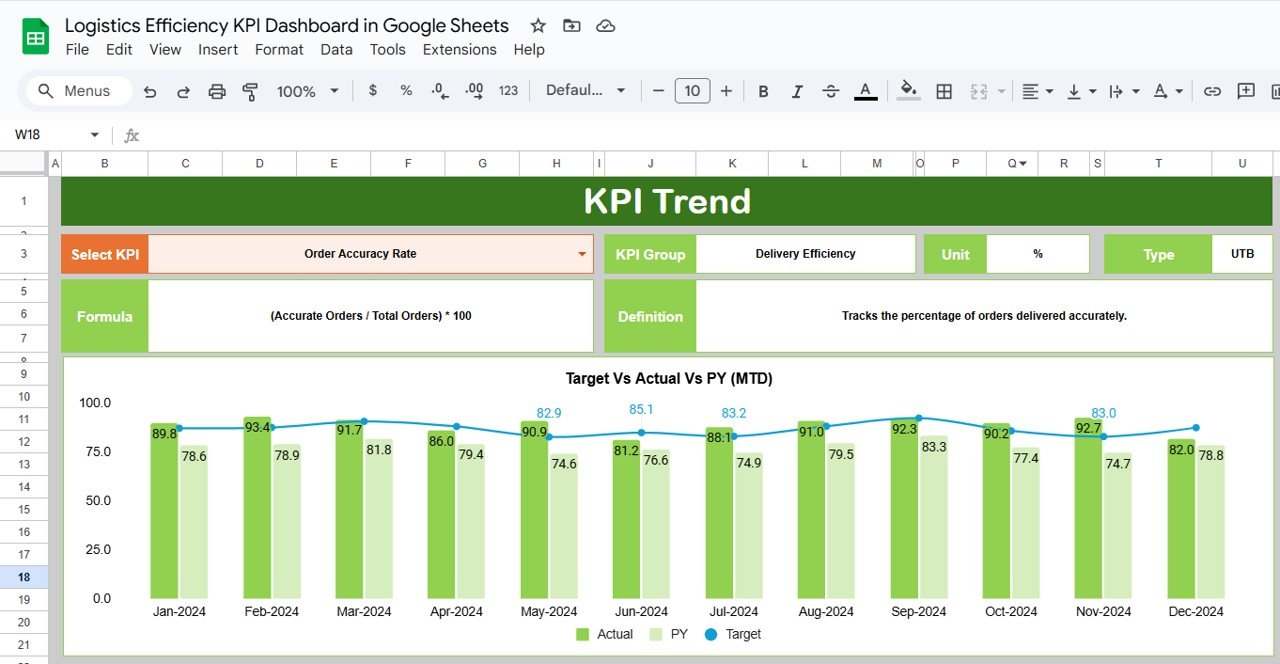
2. KPI Trend Sheet Tab
This sheet allows you to analyze the performance trends of each KPI over time. It includes:
-
KPI Name: The name of each key performance indicator.
-
KPI Group: The group to which the KPI belongs (e.g., cost, time efficiency, resource utilization).
-
Unit: The unit of measurement for each KPI (e.g., hours, percentage, cost).
-
KPI Type: Indicates whether the KPI is Lower the Better or Upper the Better.
-
Formula: The formula used to calculate the KPI.
-
Definition: A brief description of what each KPI measures.
Users can select the KPI to view its details from a drop-down list in Range C3.
Click to buy Logistics Efficiency KPI Dashboard in Google Sheets
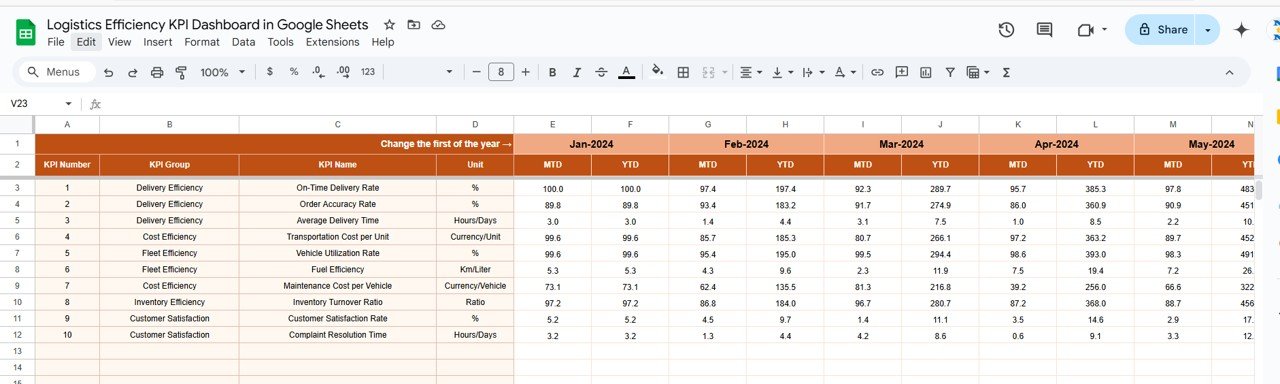
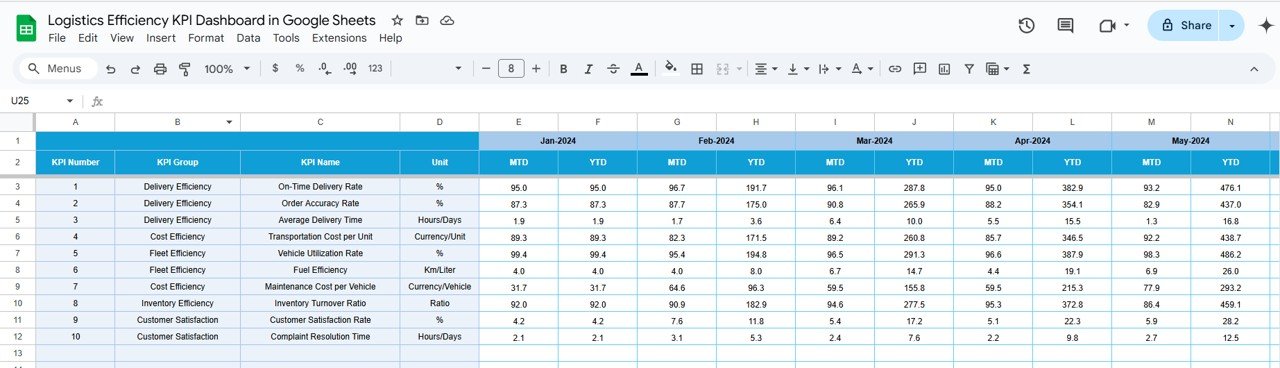
3. Actual Numbers Sheet Tab
This sheet is where you enter the actual values for MTD and YTD (Year-to-Date) for each KPI. You can change the month in Range E1, which automatically updates the data accordingly.
4. Target Sheet Tab
The Target Sheet Tab is where you input the target values for each KPI for both MTD and YTD. This allows you to track performance against the goals set for each KPI.
Click to buy Logistics Efficiency KPI Dashboard in Google Sheets
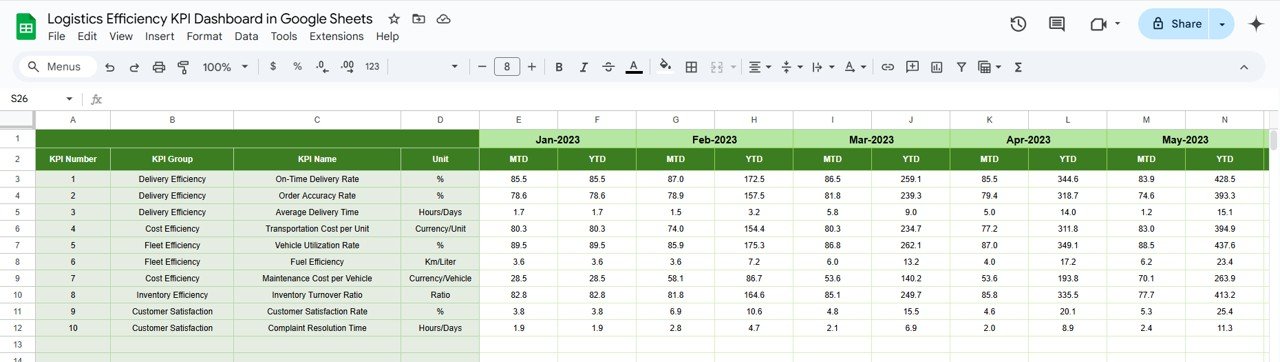
5. Previous Year Numbers Sheet Tab
In this sheet, you can enter the previous year’s data for each KPI. This comparison allows you to analyze performance improvements or declines year-over-year.
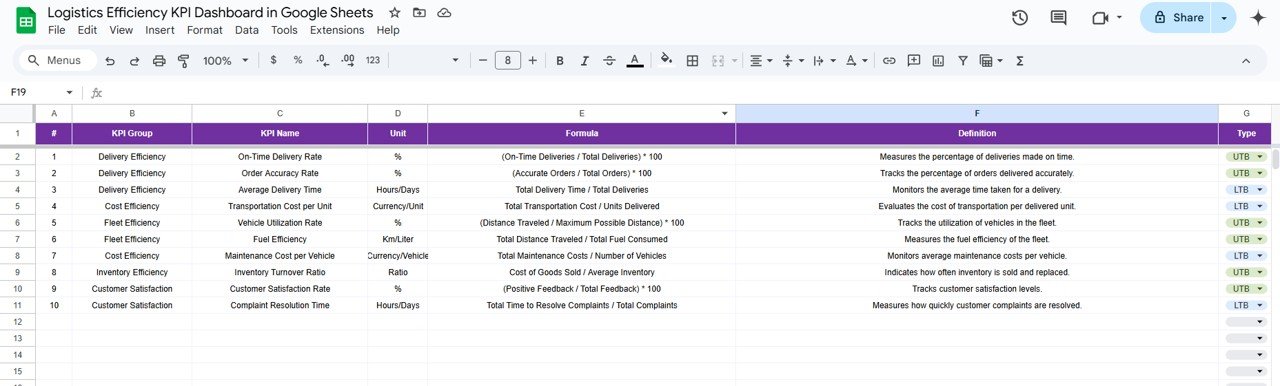
6. KPI Definition Sheet Tab
This sheet contains detailed definitions of each KPI:
-
KPI Name: The name of the key performance indicator.
-
KPI Group: The group to which the KPI belongs.
-
Unit: The unit of measurement for the KPI.
-
Formula: The formula used to calculate the KPI.
-
Definition: A short description of the KPI’s purpose and measurement.
Click to buy Logistics Efficiency KPI Dashboard in Google Sheets
Advantages of the Logistics Efficiency KPI Dashboard
-
Real-Time Monitoring: The dashboard automatically updates with the latest data, allowing you to track logistics performance in real time.
-
Comprehensive Data: It tracks a wide range of KPIs, from on-time delivery to warehouse efficiency, providing a holistic view of logistics operations.
-
Easy Comparison: Year-over-year comparisons allow you to evaluate improvements or setbacks in performance.
-
Customizable: The dashboard can be adapted to track specific KPIs relevant to your logistics operations.
Opportunities for Improvement in the Logistics Efficiency KPI Dashboard
-
Automation: Integrating automated data imports could reduce manual entry errors and improve efficiency.
-
Predictive Analytics: Adding forecasting features could help predict logistics trends and allow for proactive decision-making.
-
Mobile Optimization: Enhancing the dashboard for mobile access could increase its accessibility for field personnel and managers on the go.
-
Enhanced Reporting: Customizable reporting features could provide more in-depth analysis of KPIs and trends.
Best Practices for Using the Logistics Efficiency KPI Dashboard
Click to buy Logistics Efficiency KPI Dashboard in Google Sheets
-
Regular Updates: Keep the Actual Numbers and Target sheets updated regularly to ensure the dashboard reflects current data.
-
Review Performance Trends: Use the KPI Trend sheet to identify areas for improvement and make adjustments to operations.
-
Monitor Key Metrics: Focus on KPIs like On-Time Delivery, Cost Per Delivery, and Order Accuracy to ensure operational efficiency.
-
Use Conditional Formatting: Leverage the up/down arrows and color coding to quickly assess performance status.
Conclusion
The Logistics Efficiency KPI Dashboard in Google Sheets is an invaluable tool for logistics teams and managers seeking to optimize their operations. By providing clear, real-time insights into key metrics like delivery performance, cost, and warehouse efficiency, this dashboard enables data-driven decision-making and continuous improvement in logistics efficiency.
Frequently Asked Questions (FAQs)
1. What KPIs are tracked in the Logistics Efficiency KPI Dashboard?
The dashboard tracks KPIs such as On-Time Delivery, Cost Per Delivery, Inventory Turnover, Order Accuracy, and more.
2. How do I update the data in the Logistics Efficiency KPI Dashboard?
Data is entered into the Actual Numbers and Target sheets. The dashboard updates automatically based on this data.
3. Can I add more KPIs to the dashboard?
Yes, the dashboard is customizable, and you can add new KPIs to track additional metrics specific to your logistics operations.
4. How do I use the KPI Trend sheet?
The KPI Trend sheet allows you to analyze the performance of selected KPIs over time, providing insights into trends and areas for improvement.
5. Is the Logistics Efficiency KPI Dashboard accessible on mobile devices?
Currently, the dashboard is optimized for use in Google Sheets, and you can access it from any device with an internet connection.
Visit our YouTube channel to learn step-by-step video tutorials
Youtube.com/@NeotechNavigators
Watch the step-by-step video Demo:
Click to buy Logistics Efficiency KPI Dashboard in Google Sheets