Marketing teams generate large volumes of data every day. Campaign costs, leads, channels, revenue, and performance metrics keep changing continuously. However, without a structured reporting system, teams struggle to understand what works and what does not. That is exactly why a Marketing Analytics Dashboard in Google Sheets becomes essential.Marketing Analytics Dashboard in Google Sheets
This ready-to-use dashboard helps marketers track campaigns, analyze channels, measure ROI, and optimize spending using a single, interactive file. Moreover, it updates automatically as data changes, which allows teams to make faster and smarter decisions.Marketing Analytics Dashboard in Google Sheets
In this article, you will learn what a Marketing Analytics Dashboard in Google Sheets is, how it works, what insights it provides, and how you can use it to improve marketing performance.Marketing Analytics Dashboard in Google Sheets
What Is a Marketing Analytics Dashboard in Google Sheets?
A Marketing Analytics Dashboard in Google Sheets is an interactive reporting solution that consolidates all key marketing metrics into one place. Instead of checking multiple tools, spreadsheets, and reports, teams can monitor campaign performance, lead generation, costs, and revenue from a single dashboard.
Because it uses Google Sheets, this dashboard offers:
- Real-time updates
- Easy collaboration
- Zero software cost
- Simple customization
- Cloud-based access
As a result, marketing managers, analysts, and business owners gain full visibility into marketing performance without complex BI tools.
Dashboard Structure and Sheet Overview
Click to Buy Marketing Analytics Dashboard in Google Sheets
This dashboard includes one main Overview sheet, multiple analysis sections, and a search system. Each section focuses on a specific dimension of marketing performance.
Let us explore each part in detail.
Overview Sheet Tab – High-Level Marketing Performance
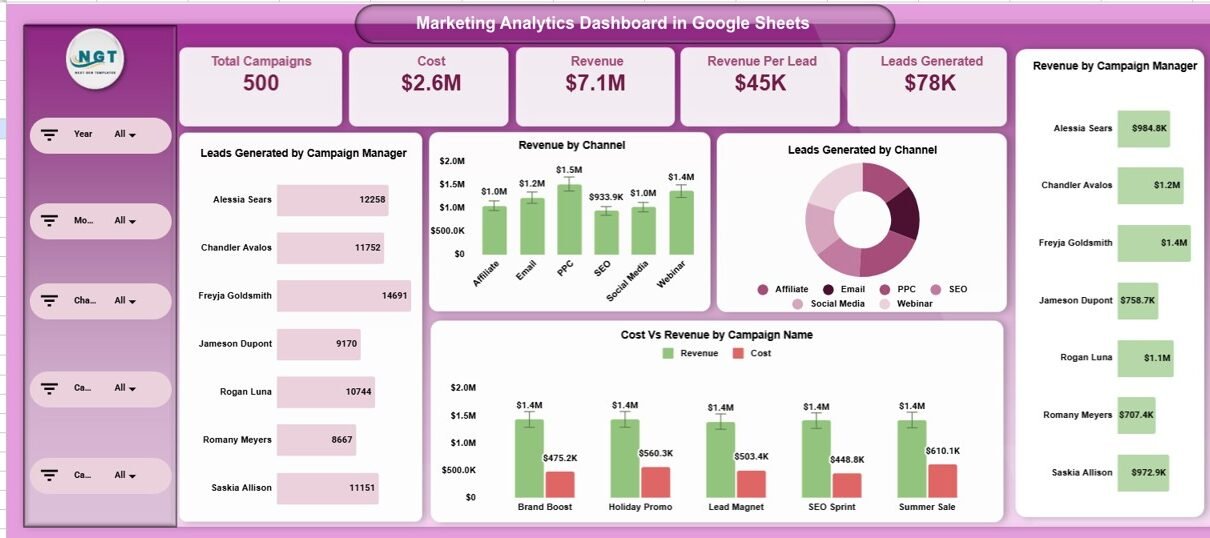
The Overview sheet acts as the executive summary of the entire dashboard. It highlights the most important KPIs using cards and charts.
KPI Cards on the Overview Sheet
These cards show key metrics at a glance:
Total Campaigns
Displays the total number of active and completed marketing campaigns.
Cost
Shows the total marketing spend across all campaigns.
Revenue
Indicates total revenue generated from marketing efforts.
Revenue Per Lead
Helps measure how much revenue each lead generates.
Leads Generated
Tracks total leads acquired through all campaigns.
These cards allow decision-makers to understand marketing performance within seconds.
Charts on the Overview Sheet
Click to Buy Marketing Analytics Dashboard in Google Sheets
The dashboard includes several charts to visualize performance clearly.
Leads Generated by Campaign Manager
Shows which managers generate the highest number of leads.
Revenue by Channel
Displays how much revenue each marketing channel contributes.
Leads Generated by Channel
Helps identify which channels perform best in lead generation.
Cost vs Revenue by Campaign Name
Compares campaign spend with revenue to evaluate ROI.
Revenue by Campaign Manager
Highlights revenue contribution by each campaign manager.
Together, these charts provide a strong overview of efficiency, profitability, and accountability.

Click to Buy Marketing Analytics Dashboard in Google Sheets
Campaign Analysis – Deep Dive into Campaign Performance
The Campaign Analysis section focuses on individual campaign effectiveness.
Campaign Analysis Charts
Leads Generated by Campaign Name
Identifies high-performing and underperforming campaigns.
Revenue Per Lead by Campaign Name
Shows which campaigns attract high-quality leads.
Cost Per Lead by Campaign Name
Helps control acquisition costs.
Cost vs Revenue by Campaign Name
Reveals ROI at the campaign level.
This analysis helps marketers decide which campaigns to scale and which to optimize or stop.

Click to Buy Marketing Analytics Dashboard in Google Sheets
Channel Analysis – Which Channels Perform Best?
Marketing teams use multiple channels such as email, social media, paid ads, and organic search. The Channel Analysis section compares these channels side by side.
Channel Analysis Charts
Leads Generated by Channel
Shows lead volume from each channel.
Revenue Per Lead by Channel
Measures lead quality across channels.
Cost Per Lead by Channel
Tracks cost efficiency.
Cost vs Revenue by Channel
Evaluates channel-level profitability.
With these insights, teams can reallocate budgets toward high-ROI channels.

Click to Buy Marketing Analytics Dashboard in Google Sheets
Campaign Manager Analysis – Performance by Owner
Accountability matters in marketing. The Campaign Manager Analysis section evaluates individual performance.
Campaign Manager Analysis Charts
Leads Generated by Campaign Manager
Shows productivity by manager.
Cost vs Revenue by Campaign Manager
Highlights efficiency and ROI.
Cost Per Lead by Campaign Manager
Tracks acquisition cost control.
Revenue Per Lead by Campaign Manager
Measures lead quality delivered by each manager.
This section supports fair performance reviews and resource planning.

Click to Buy Marketing Analytics Dashboard in Google Sheets
Monthly Trends – Track Performance Over Time
Marketing performance changes over time. The Monthly Trends section helps teams identify seasonality and growth patterns.
Monthly Trend Charts
Leads Generated by Month
Shows demand trends.
Cost vs Revenue by Month
Tracks profitability over time.
Cost Per Lead by Month
Helps spot inefficiencies early.
Revenue Per Lead by Month
Measures improvement in lead quality.
These trends help marketers plan future campaigns more effectively.

Click to Buy Marketing Analytics Dashboard in Google Sheets
Search Functionality – Find Data Instantly
The dashboard includes a Search Panel that allows users to:
-
Enter a Search Keyword
-
Select a Field Name (Campaign, Channel, Manager, Month, etc.)
The dashboard instantly filters and displays matching records.
Benefits of Search
-
Faster analysis
-
Easier audits
-
Quick campaign reviews
-
Improved productivity
This feature becomes extremely useful when managing large datasets.

Click to Buy Marketing Analytics Dashboard in Google Sheets
Advantages of a Marketing Analytics Dashboard in Google Sheets
Using this dashboard provides multiple benefits:
- Centralized marketing data
- Real-time performance visibility
- Easy ROI tracking
- Improved budget control
- Better campaign optimization
- No technical or BI skills required
- Scalable for small and large teams
Because of these advantages, many organizations prefer Google Sheets dashboards for marketing analytics.
Opportunities for Improvement in Marketing Analytics
Even though this dashboard is powerful, teams can enhance it further:
- Add conversion rate metrics
- Include customer acquisition cost (CAC)
- Integrate data from Google Ads or Facebook Ads
- Add automated data refresh using APIs
- Include funnel-level analysis
These improvements make marketing insights even more actionable.
Best Practices for Using the Marketing Analytics Dashboard
Click to Buy Marketing Analytics Dashboard in Google Sheets
To get the most value from this dashboard, follow these best practices:
- Update data regularly
- Maintain consistent campaign naming
- Review dashboard weekly
- Compare cost vs revenue before scaling campaigns
- Use channel analysis to reallocate budgets
- Share insights with sales and leadership teams
Consistent usage ensures better decision-making.
Conclusion
Click to Buy Marketing Analytics Dashboard in Google Sheets
A Marketing Analytics Dashboard in Google Sheets helps teams transform raw marketing data into clear, actionable insights. It simplifies performance tracking, improves budget control, and enhances campaign optimization. Because it is ready to use, cloud-based, and highly customizable, this dashboard fits businesses of all sizes.
With structured cards, powerful charts, deep-dive analysis sections, and an advanced search feature, this dashboard becomes an essential tool for modern marketing teams.
Frequently Asked Questions (FAQs)
What teams can use this dashboard?
Marketing managers, digital marketers, analysts, founders, and agencies.
Do I need technical skills to use it?
No, basic Google Sheets knowledge is enough.
Can I customize metrics and charts?
Yes, you can fully customize it.
Does it support collaboration?
Yes, multiple users can work simultaneously.
Can it replace marketing BI tools?
For many teams, yes—especially for reporting and performance tracking.
Visit our YouTube channel to learn step-by-step video tutorials
Youtube.com/@NeotechNavigators
Watch the step-by-step video tutorial: