Marketing teams invest heavily in campaigns, channels, and managers. However, without proper tracking, marketing spend often grows faster than revenue. Because of this, businesses struggle to understand which campaigns actually perform well.
That is exactly why a Marketing Spend and Revenue Dashboard in Google Sheets becomes essential.
In this detailed article, you will learn what this dashboard is, how it works, why it matters, and how each dashboard page helps you control marketing costs and maximize revenue. Moreover, you will explore its advantages, best practices, and frequently asked questions, so you can confidently use it for real-world decision-making.
What Is a Marketing Spend and Revenue Dashboard in Google Sheets?
Click to Buy Marketing Spend and Revenue Dashboard in Google Sheets
A Marketing Spend and Revenue Dashboard in Google Sheets is an interactive reporting solution that tracks and compares:
- Marketing cost
- Revenue generated
- Leads generated
- Cost per lead
- Revenue per lead
Instead of reviewing raw campaign data, this dashboard converts numbers into clear KPI cards, charts, and trend analysis. As a result, marketing teams can instantly understand performance without manual calculations.
Because the dashboard runs on Google Sheets, it allows:
- Real-time collaboration
- Easy sharing
- Cloud-based access
- No software installation
Why Do Businesses Need a Marketing Spend and Revenue Dashboard?
Marketing decisions should always rely on data. However, many teams still track spend and revenue in separate files. Because of this, they fail to see the complete picture.
Common Problems Without a Dashboard
- No visibility into cost vs revenue
- Difficulty tracking lead efficiency
- Manual reporting errors
- Delayed performance reviews
- Poor budget allocation
Therefore, a structured Marketing Spend and Revenue Dashboard solves these issues by providing one centralized view.
Overview of Marketing Spend and Revenue Dashboard in Google Sheets
Click to Buy Marketing Spend and Revenue Dashboard in Google Sheets
This dashboard gives a complete marketing performance overview. It includes:
- KPI summary cards
- Campaign analysis
- Channel analysis
- Campaign manager analysis
- Monthly trends
- Searchable data table
- Interactive slicers
Most importantly, it works as a ready-to-use Google Sheets template.
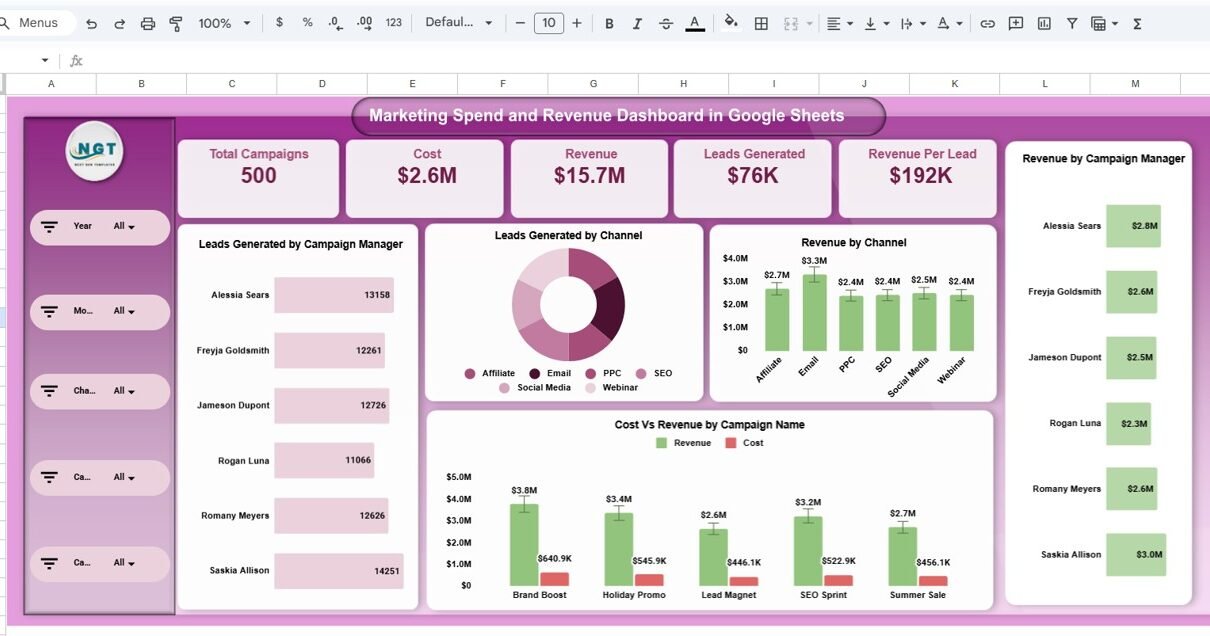
Overview Page: What Key Metrics Can You See Instantly?
The Overview page highlights the most important marketing KPIs.
Key KPI Cards on Overview Page
- Total Campaigns
- Total Cost
- Total Revenue
- Leads Generated
- Revenue per Lead
Because these KPIs appear at the top, decision-makers can quickly assess marketing performance.

Click to Buy Marketing Spend and Revenue Dashboard in Google Sheets
Campaign Analysis: Which Campaigns Deliver the Best Results?
The Campaign Analysis page compares performance at the individual campaign level.
Insights Available
- Leads Generated by Campaign Name
- Cost vs Revenue by Campaign Name
- Revenue per Lead by Campaign Name
- Cost per Lead by Campaign Name
As a result, teams can identify:
- High-performing campaigns
- Cost-heavy campaigns with low returns
- Campaigns that need optimization

Click to Buy Marketing Spend and Revenue Dashboard in Google Sheets
Campaign Manager Analysis: Who Drives the Most Revenue?
Marketing success also depends on campaign ownership. The Campaign Manager Analysis page evaluates performance by manager.
Key Visuals
- Leads Generated by Campaign Manager
- Cost vs Revenue by Campaign Manager
- Revenue per Lead by Campaign Manager
- Cost per Lead by Campaign Manager
Therefore, leadership can:
- Measure individual performance
- Identify top performers
- Improve accountability

Click to Buy Marketing Spend and Revenue Dashboard in Google Sheets
Channel Analysis: Which Channels Are Most Efficient?
Different channels perform differently. Because of this, the Channel Analysis page plays a crucial role.
Metrics Covered
- Leads Generated by Channel
- Cost vs Revenue by Channel
- Revenue per Lead by Channel
- Cost per Lead by Channel
Channels include:
- Affiliate
- PPC
- SEO
- Social Media
- Webinar
As a result, teams can shift budgets toward high-ROI channels.

Click to Buy Marketing Spend and Revenue Dashboard in Google Sheets
Monthly Trends: How Does Performance Change Over Time?
Marketing performance changes every month. The Monthly Trends page helps track these changes clearly.
Monthly Metrics
- Leads Generated by Month
- Cost vs Revenue by Month
- Revenue per Lead by Month
- Cost per Lead by Month
Because of this page, teams can:
- Identify seasonal trends
- Plan future campaigns better
- Avoid overspending in low-performing months

Click to Buy Marketing Spend and Revenue Dashboard in Google Sheets
Search & Data Table: How Can You Analyze Campaign-Level Data?
The dashboard includes a searchable data table for detailed analysis.
Key Features
- Search by keyword
- Filter by selected column
- Campaign-level visibility
Data Fields Included
- Campaign ID & Name
- Channel
- Campaign Manager
- Start Date & End Date
- Campaign Spend
- Leads Generated
- Conversions
- Revenue
- Revenue per Lead
- Cost per Lead
- ROI
- Month & Year
Therefore, users can drill down into any campaign instantly.

Click to Buy Marketing Spend and Revenue Dashboard in Google Sheets
Slicers & Filters: How Do They Improve Usability?
The dashboard includes slicers for:
- Year
- Month
- Channel
- Campaign
- Campaign Manager
Because slicers update all visuals instantly, analysis becomes fast, flexible, and interactive.
Advantages of Marketing Spend and Revenue Dashboard in Google Sheets
-
Clear view of marketing cost vs revenue
-
Easy lead efficiency tracking
-
Real-time collaboration
-
No complex tools required
-
Improves budget decisions
-
Saves reporting time
-
Fully customizable
Best Practices for Using Marketing Spend and Revenue Dashboard
Click to Buy Marketing Spend and Revenue Dashboard in Google Sheets
-
Keep campaign data updated regularly
-
Review cost per lead weekly
-
Compare managers objectively
-
Focus on revenue per lead, not just volume
-
Use monthly trends for forecasting
-
Share dashboard access with stakeholders
Who Should Use This Dashboard?
- Marketing Managers
- Digital Marketing Teams
- Growth Teams
- Marketing Agencies
- Business Owners
- Startups and Enterprises
Conclusion: Why Marketing Spend and Revenue Dashboard in Google Sheets Matters
Click to Buy Marketing Spend and Revenue Dashboard in Google Sheets
The Marketing Spend and Revenue Dashboard in Google Sheets helps businesses move from guesswork to data-driven marketing. Instead of focusing only on spend, teams can clearly see what generates real revenue.
Because the dashboard is visual, collaborative, and easy to use, it enables better decisions, smarter budgeting, and higher ROI.
If you want full visibility into your marketing performance, this dashboard is a powerful solution.
Frequently Asked Questions (FAQs)
Click to Buy Marketing Spend and Revenue Dashboard in Google Sheets
What is the main purpose of this dashboard?
It tracks marketing spend, revenue, and lead efficiency in one place.
Can I use it for multiple campaigns?
Yes, it supports multiple campaigns, channels, and managers.
Does it require advanced Google Sheets skills?
No, it is beginner-friendly and ready to use.
Can I customize metrics?
Yes, all charts and KPIs are customizable.
Is this dashboard suitable for agencies?
Yes, agencies can track multiple clients or campaigns.
Does it support collaboration?
Yes, Google Sheets allows real-time collaboration.
Visit our YouTube channel to learn step-by-step video tutorials
Youtube.com/@NeotechNavigators
Click to Buy Marketing Spend and Revenue Dashboard in Google Sheets