In today’s world, non-profit organizations face unique challenges that require efficient tracking and management of their goals and performance. To make data-driven decisions, non-profits need an effective way to measure and monitor their key performance indicators (KPIs). One of the best ways to track these KPIs is by using a Non-Profit KPI Dashboard in Google Sheets. This tool allows non-profit organizations to visualize their performance in a simple, effective, and customizable way.
In this article, we will explore the features and KPIs in the Non-Profit KPI Dashboard in Google Sheets, how it works, and why it’s a valuable asset for non-profits. We will also discuss best practices, opportunities for improvement, and answer some frequently asked questions.
What is a Non-Profit KPI Dashboard?
A Non-Profit KPI Dashboard is a visual tool that helps non-profit organizations track their performance against specific goals. These KPIs can include fundraising efforts, donor engagement, program impact, volunteer participation, and financial health. By using a dashboard, non-profits can see a comprehensive view of their operations, identify areas needing improvement, and make informed decisions to increase efficiency and effectiveness.
Creating a KPI dashboard in Google Sheets is cost-effective, accessible, and customizable. This makes it ideal for non-profits with limited budgets or resources but still requires an effective way to monitor their performance.
Key Features of the Non-Profit KPI Dashboard in Google Sheets
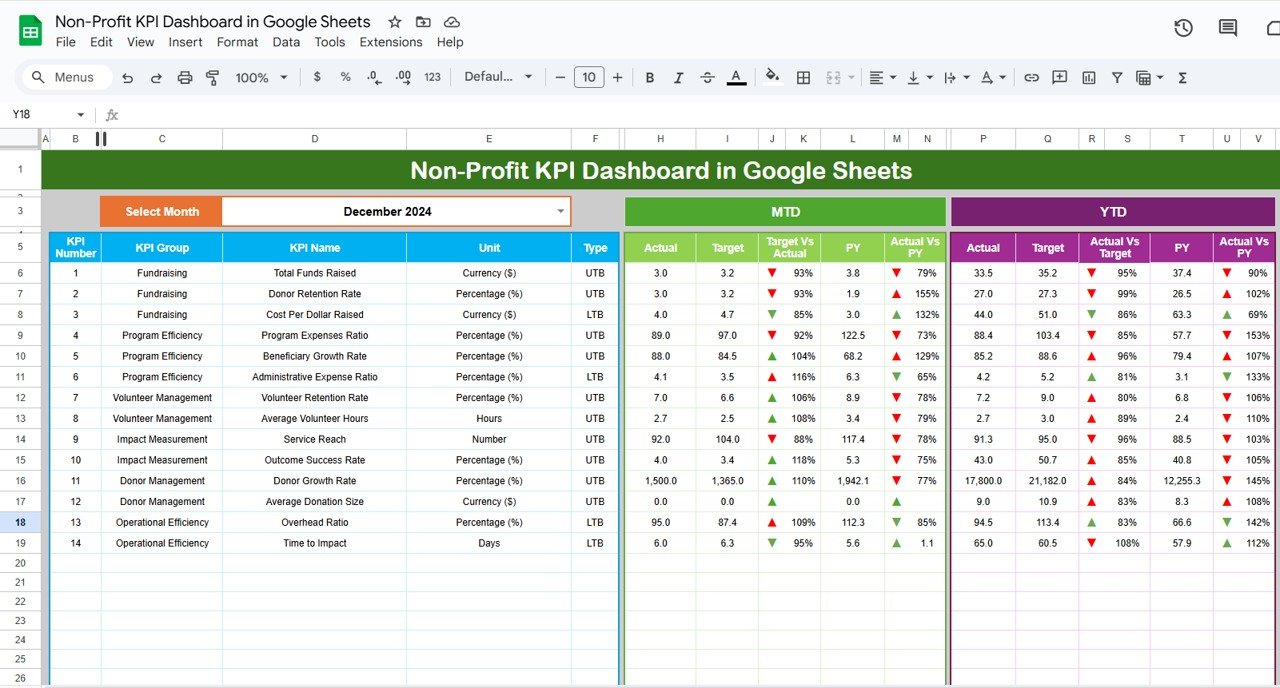
This ready-to-use Non-Profit KPI Dashboard in Google Sheets offers numerous features that make it easy to track and analyze key metrics for your organization. Below are the six main worksheets that make up the dashboard:
1. Dashboard Sheet Tab
Overview: The Dashboard Sheet serves as the central hub of the KPI dashboard. It displays all key metrics in a visual and interactive format.
Key Information:
- MTD Actual: This represents the actual performance for the current month.
- MTD Target: This is the target set for the current month.
- Previous Year (PY) Data: This shows the comparison with the previous year’s performance.
- Target vs Actual Comparison: Shows how well the actual data meets the target.
- PY vs Actual Comparison: Compares the current year’s actual data to the previous year’s data.
Click to buy Non-Profit KPI Dashboard in Google Sheets
Dynamic Functionality: You can select the month from the dropdown menu (Range D3) to update the entire dashboard. The data for that month will automatically change to reflect the new month.
Conditional Formatting: The dashboard uses up and down arrows to highlight performance against targets, making it easy to identify successes and areas for improvement.
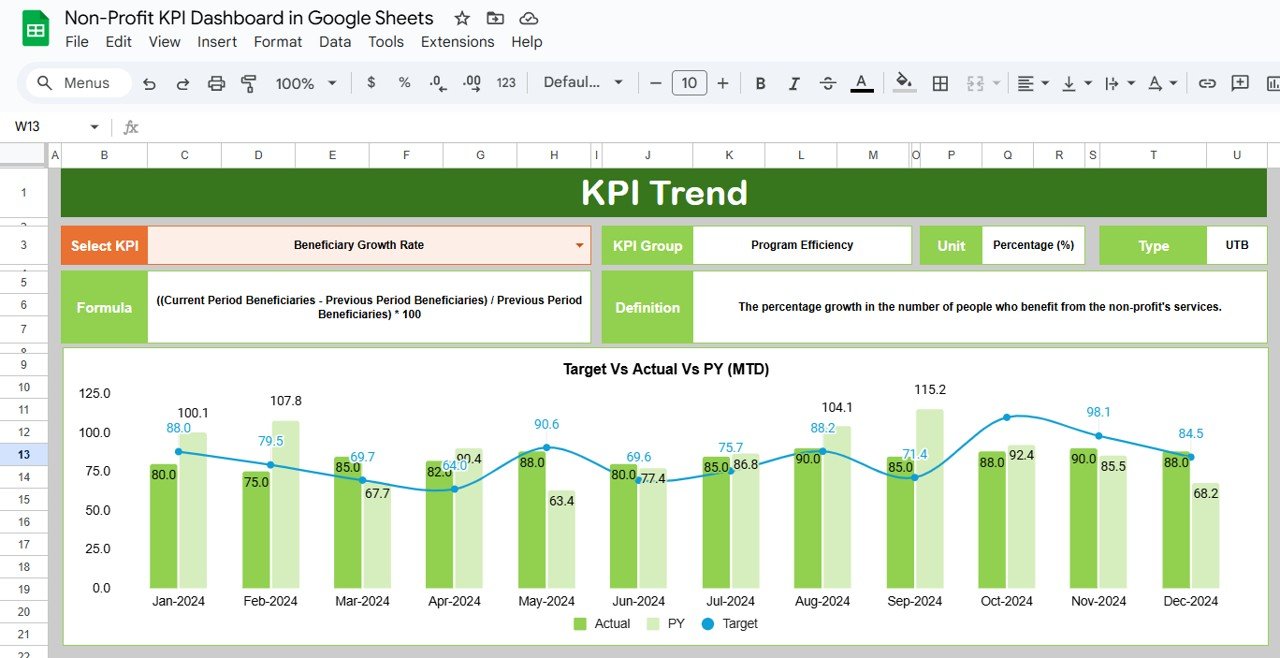
KPI Trend Sheet Tab
Overview: This sheet allows you to track and visualize trends for individual KPIs.
Features:
- Dropdown to select the KPI (Range C3).
- Displays KPI Group, Unit of KPI, and whether the KPI is a “Lower the Better” or “Upper the Better” type.
- Formula: Provides the formula used to calculate the KPI.
- KPI Definition: Explains the meaning and significance of the KPI.
Click to buy Non-Profit KPI Dashboard in Google Sheets
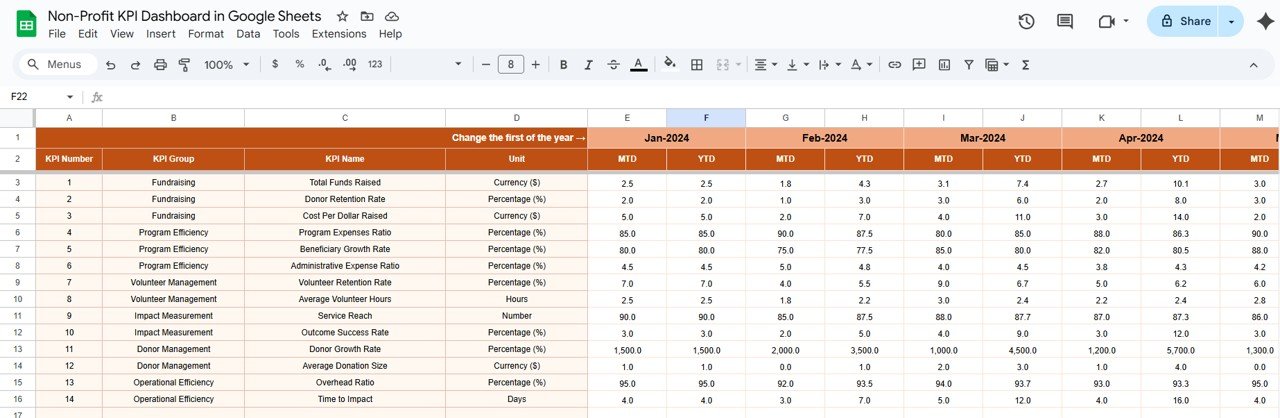
3. Actual Numbers Sheet Tab
Overview: This sheet is where you input the actual data for MTD and YTD (Year-to-Date) values for a specific month.
Functionality:
- The month can be selected via the dropdown (Range E1).
- Users can input actual data values to track performance over time.
Click to buy Non-Profit KPI Dashboard in Google Sheets
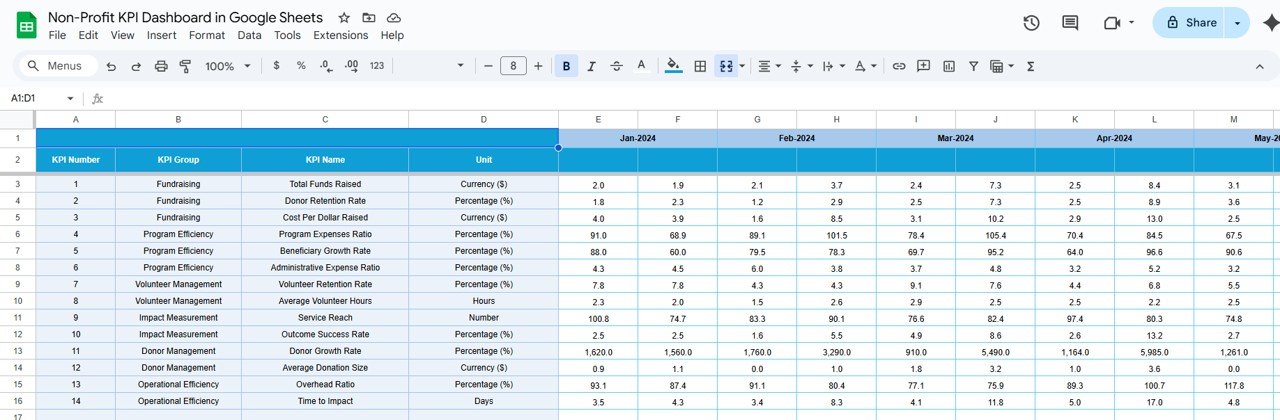
4. Target Sheet Tab
Overview: The Target Sheet is used to input the target numbers for each KPI, both for MTD and YTD.
Functionality:
- Targets can be set for each KPI for a particular month. This helps track progress toward the overall goals of the non-profit organization.
Click to buy Non-Profit KPI Dashboard in Google Sheets
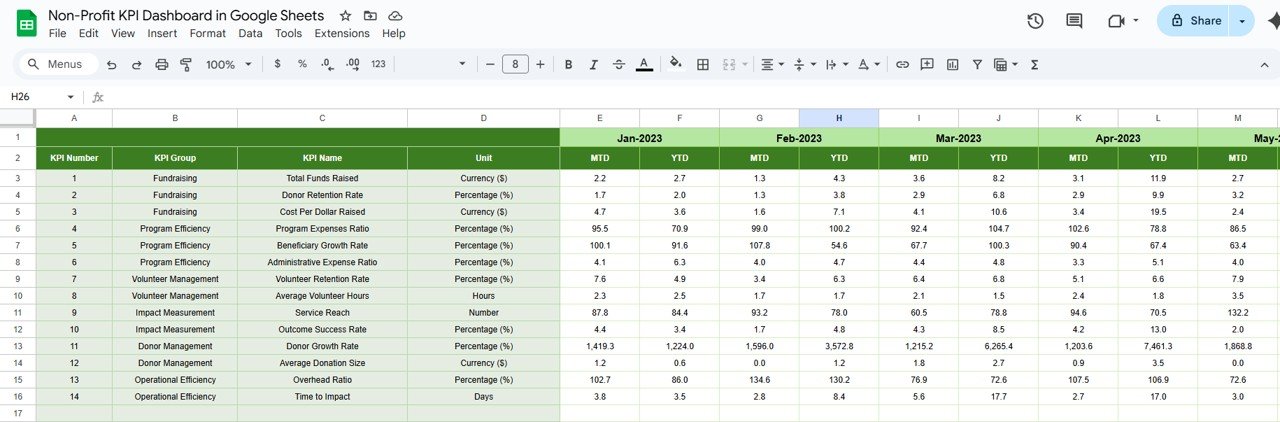
5. Previous Year Numbers Sheet Tab
Overview: This sheet stores the data for the previous year’s performance.
Functionality:
- The previous year’s data is entered here to facilitate historical comparisons. This gives insight into whether the current year’s performance is improving.
Click to buy Non-Profit KPI Dashboard in Google Sheets
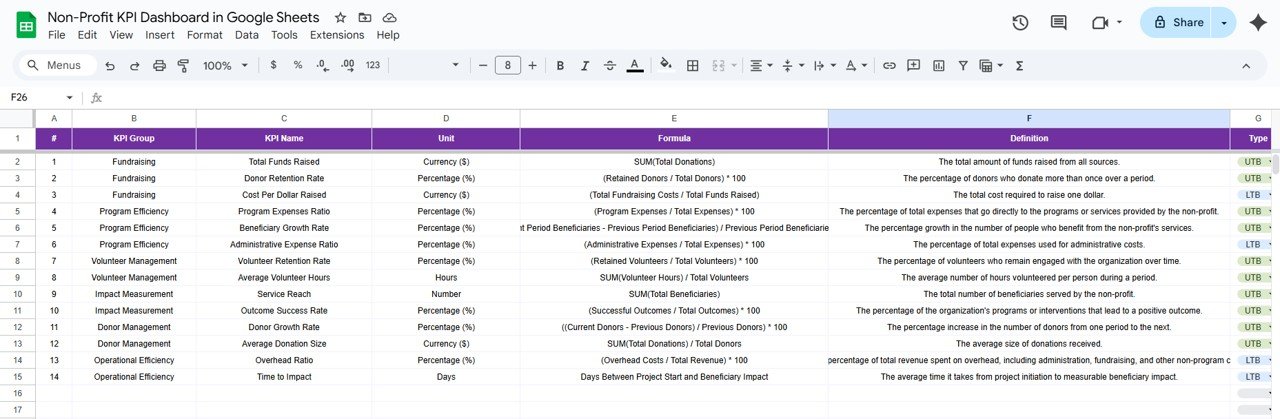
6. KPI Definition Sheet Tab
Overview: This sheet includes detailed definitions for each KPI.
Features:
- KPI Name
- KPI Group
- Unit of Measurement
- Formula
- Definition
Click to buy Non-Profit KPI Dashboard in Google Sheets
Advantages of Using a Non-Profit KPI Dashboard in Google Sheets
Using a Non-Profit KPI Dashboard in Google Sheets offers several advantages for non-profit organizations, helping them manage their performance efficiently.
- Easy Access and Collaboration: Google Sheets is a cloud-based tool, making it accessible from anywhere and allowing multiple users to collaborate in real time. This is especially useful for non-profits with distributed teams.
- Customizable and Scalable: The dashboard is customizable to fit the unique needs of your organization. Whether you need to track fundraising, volunteers, or program impact, you can add or modify KPIs as necessary.
- Cost-Effective: Google Sheets is free to use, making it an affordable solution for non-profits with limited budgets.
- Visual Representation of Data: The dashboard allows non-profits to see key data in a visual format, making it easier to spot trends, track performance, and make informed decisions.
- Real-Time Updates: Once data is entered, the dashboard automatically updates, allowing non-profits to have real-time access to their KPIs.
Opportunities for Improvement in the Non-Profit KPI Dashboard
While the Non-Profit KPI Dashboard in Google Sheets is a powerful tool, there are opportunities for enhancement to make it even more effective.
- Automation Integration: Non-profits can integrate the dashboard with external data sources or use Google Apps Script to automate data entry. This reduces the need for manual data updates and ensures accuracy.
- Advanced Analytics: While Google Sheets offers basic calculations, non-profits could benefit from integrating more advanced analytics tools like Google Data Studio for more sophisticated data visualization and analysis.
- Mobile-Friendly Design: Making the dashboard mobile-friendly can improve access, especially for team members who need to check KPIs on the go.
Best Practices for Implementing a Non-Profit KPI Dashboard
Click to buy Non-Profit KPI Dashboard in Google Sheets
To maximize the effectiveness of your Non-Profit KPI Dashboard in Google Sheets, here are some best practices to follow:
- Set Clear and Measurable Goals: Define what success looks like for your organization. For example, if your goal is to increase fundraising, set a specific target (e.g., raise $100,000 in 12 months).
- Update Data Regularly: Consistently update the data in the dashboard to ensure it remains accurate and useful for decision-making.
- Train Your Team: Ensure all team members understand how to use the dashboard, input data, and interpret the KPIs. This will help everyone stay aligned and focused on achieving goals.
- Analyze Trends Over Time: Regularly review the trends in your KPIs to identify areas for improvement and take corrective actions before small issues become large problems.
Conclusion
A Non-Profit KPI Dashboard in Google Sheets is an invaluable tool for any non-profit organization looking to track its performance and make data-driven decisions. By providing real-time insights into fundraising efforts, volunteer engagement, and program impact, non-profits can maximize their resources and improve outcomes. With its accessibility, customizability, and ease of use, this dashboard is an excellent resource for non-profits at every stage of their journey.
Frequently Asked Questions with Answers
1. How do I customize the Non-Profit KPI Dashboard in Google Sheets?
You can customize the dashboard by adding new KPIs, modifying existing ones, or adjusting the layout to meet your organization’s needs.
2. Can I share the dashboard with my team?
Yes, Google Sheets allows you to share the dashboard with multiple users, enabling collaboration and real-time data updates.
3. Is it possible to track multiple non-profits on the same dashboard?
Yes, the dashboard can be adapted to track performance across multiple non-profits by adjusting the data structure.
4. How often should I update the data on the dashboard?
It’s best to update the data regularly—monthly or quarterly—depending on your organization’s needs.
5. Can I use the Non-Profit KPI Dashboard for grant tracking?
Yes, you can track grant applications, funding received, and grant success rates using the relevant KPIs in the dashboard.
Click to buy Non-Profit KPI Dashboard in Google Sheets
Visit our YouTube channel to learn step-by-step video tutorials
Youtube.com/@NeotechNavigators