Every organization depends on IT support to keep daily operations running smoothly. Employees raise tickets for system issues, software access, hardware problems, network outages, and application errors. However, when IT teams track these requests in emails or scattered spreadsheets, visibility drops and response time increases. As a result, productivity suffers and user satisfaction declines.Office IT Helpdesk Dashboard in Google Sheets
This is where an Office IT Helpdesk Dashboard in Google Sheets becomes extremely valuable. This ready-to-use dashboard helps IT teams track tickets, costs, response times, and resolution performance in one centralized and visual system. Moreover, it updates automatically and supports real-time collaboration.Office IT Helpdesk Dashboard in Google Sheets
In this article, we will explain the Office IT Helpdesk Dashboard in Google Sheets in detail. You will learn how the dashboard works, what each sheet contains, how the charts help analysis, and how organizations benefit from using this dashboard.Office IT Helpdesk Dashboard in Google Sheets
What Is an Office IT Helpdesk Dashboard in Google Sheets?
An Office IT Helpdesk Dashboard is a centralized reporting and monitoring tool that tracks all IT support tickets and related metrics. It consolidates ticket volume, ticket status, cost, response time, and resolution performance into a single interactive dashboard.
Because this dashboard is built in Google Sheets, it offers:
- Real-time updates
- Easy collaboration
- No software installation
- Automated calculations
- Interactive charts
- Powerful search functionality
This dashboard works perfectly for IT teams, system administrators, service desk managers, and operations leaders.
Key Features of the Office IT Helpdesk Dashboard
Click to Buy Office IT Helpdesk Dashboard in Google Sheets
This dashboard includes:
- Overview sheet with KPI cards and charts
- Location-wise analysis
- Department-wise analysis
- Channel-wise analysis
- Monthly trend analysis
- Smart search functionality
- Structured data sheet
Each feature focuses on improving visibility, control, and decision-making.
Overview Sheet Tab
Click to Buy Office IT Helpdesk Dashboard in Google Sheets
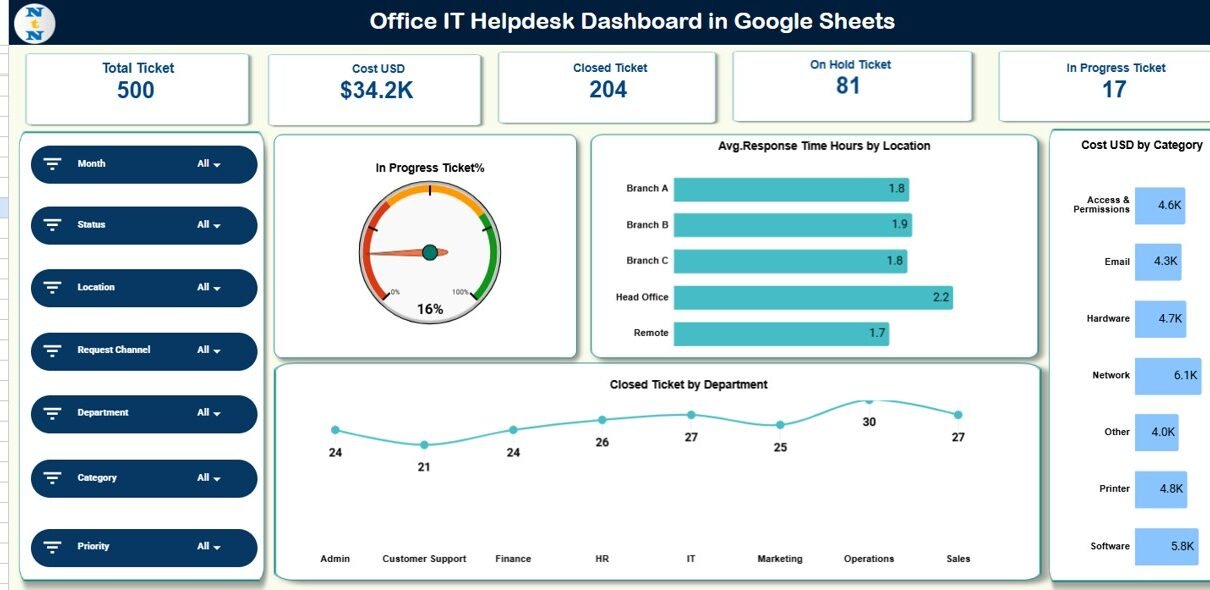
The Overview sheet acts as the main control panel of the dashboard. It provides a quick snapshot of IT helpdesk performance using KPI cards and charts.
KPI Cards in the Overview Sheet
The dashboard displays the following cards:
Total Ticket
Shows the total number of IT helpdesk tickets raised.
Cost (USD)
Displays the total IT support cost incurred.
Closed Ticket
Indicates how many tickets were successfully resolved.
On Hold Ticket
Shows tickets waiting for approval, input, or resources.
In Progress Ticket
Tracks tickets currently under investigation or resolution.
These cards allow managers to assess workload and performance instantly.
Charts in the Overview Sheet
In Progress Ticket %
Shows the percentage of tickets currently in progress.
Average Response Time (Hours) by Location
Helps identify locations with slower IT response.
Cost USD by Category
Displays IT support cost by issue type or category.
Closed Ticket by Department
Highlights which departments generate the most resolved tickets.
These charts help identify bottlenecks and resource needs quickly.

Click to Buy Office IT Helpdesk Dashboard in Google Sheets
Location Analysis Sheet
The Location Analysis sheet focuses on performance across office locations.
Charts Included:
-
Cost USD by Location
-
Resolved vs In Progress Ticket by Location
-
Average Response Time (Hours) by Location
-
Total Ticket by Location
This analysis helps IT leaders understand which locations face higher IT issues, higher costs, or slower response times.

Click to Buy Office IT Helpdesk Dashboard in Google Sheets
Department Analysis Sheet
The Department Analysis sheet shows how IT issues vary across departments.
Charts Included:
-
Cost USD by Department
-
Resolved vs In Progress Ticket by Department
-
Average Response Time (Hours) by Department
-
Total Ticket by Department
This helps organizations identify departments that need better systems, training, or infrastructure improvements.

Click to Buy Office IT Helpdesk Dashboard in Google Sheets
Channel Analysis Sheet
The Channel Analysis sheet explains how employees raise IT tickets.
Charts Included:
-
Cost USD by Channel
-
Resolved vs In Progress Ticket by Channel
-
Total Ticket by Channel
-
Average Response Time (Hours) by Channel
Typical channels include Email, Phone, Portal, Chat, or Walk-in. This analysis helps improve channel efficiency and automation strategies.

Click to Buy Office IT Helpdesk Dashboard in Google Sheets
Monthly Trends Sheet
The Monthly Trends sheet helps track IT performance over time.
Charts Included:
-
Cost USD by Month
-
Resolved vs In Progress Ticket by Month
-
Average Response Time (Hours) by Month
-
Total Ticket by Month
This view helps detect seasonal spikes, recurring issues, and improvement trends.

Click to Buy Office IT Helpdesk Dashboard in Google Sheets
Search Functionality – Search by Keyword and Field Name
The dashboard includes a powerful Search Panel.
You can search by:
- Ticket ID
- Employee Name
- Department
- Location
- Category
- Channel
- Status
Simply enter the Search Keyword and select the Field Name, and the dashboard instantly filters matching records.
This feature saves time during:
- Audits
- Escalations
- Management reviews
- User follow-ups

Click to Buy Office IT Helpdesk Dashboard in Google Sheets
Data Sheet
The Data sheet stores all ticket-level information, such as:
- Ticket ID
- Request Date
- Department
- Location
- Issue Category
- Channel
- Ticket Status
- Cost USD
- Response Time (Hours)
All dashboard visuals update automatically based on this data.

Click to Buy Office IT Helpdesk Dashboard in Google Sheets
Advantages of the Office IT Helpdesk Dashboard
Centralized IT Visibility
All ticket data stays in one structured dashboard.
Faster Decision-Making
Managers identify issues and act quickly.
Improved SLA Monitoring
Response time and resolution tracking improve accountability.
Better Cost Control
Cost charts highlight high-expense categories.
Higher Employee Satisfaction
Faster resolution improves internal user experience.
Easy to Use
Google Sheets requires no special technical skills.
Opportunities for Improvement in IT Helpdesk Tracking
Click to Buy Office IT Helpdesk Dashboard in Google Sheets
Organizations can enhance this dashboard further by adding:
-
SLA breach alerts
-
Ticket aging analysis
-
Priority-based resolution tracking
-
Automation using Google Apps Script
-
Integration with ITSM tools like Jira or ServiceNow
-
User satisfaction survey metrics
These improvements make the dashboard more advanced and proactive.
Best Practices for Using the IT Helpdesk Dashboard
Click to Buy Office IT Helpdesk Dashboard in Google Sheets
-
Update ticket data daily
-
Standardize issue categories and statuses
-
Review response time weekly
-
Monitor cost trends monthly
-
Use search during escalations
-
Share dashboard with leadership regularly
Consistent usage improves IT service quality over time.
Conclusion
Click to Buy Office IT Helpdesk Dashboard in Google Sheets
An Office IT Helpdesk Dashboard in Google Sheets gives organizations full control over IT support operations. It simplifies ticket tracking, improves response time visibility, and enhances cost monitoring. Because it combines powerful charts, clear KPIs, and smart search features, this dashboard becomes an essential tool for IT teams and management.
With proper usage, organizations reduce downtime, improve service quality, and build a more responsive IT environment.
Frequently Asked Questions (FAQs)
1. Who should use this IT Helpdesk Dashboard?
IT support teams, service desk managers, operations leaders, and system administrators.
2. Can I customize categories and locations?
Yes, the dashboard is fully customizable.
3. Does the dashboard update automatically?
Yes, charts and cards update when data changes.
4. Is Google Sheets secure for IT data?
Yes, with proper access control and permissions.
5. Can this dashboard track SLA compliance?
Yes, you can add SLA fields and formulas easily.
6. Does it support multiple offices?
Yes, it works well for multi-location organizations.
Visit our YouTube channel to learn step-by-step video tutorials
Youtube.com/@NeotechNavigators
Watch the step-by-step video tutorial: