Managing office tasks effectively requires more than just maintaining to-do lists. Teams must track task completion, urgency, duration, costs, and performance across departments, locations, and individuals. However, when data remains scattered across files or tools, performance insights become unclear and delayed.
That is exactly why the Office Task Management Performance Dashboard in Google Sheets is a powerful and practical solution.
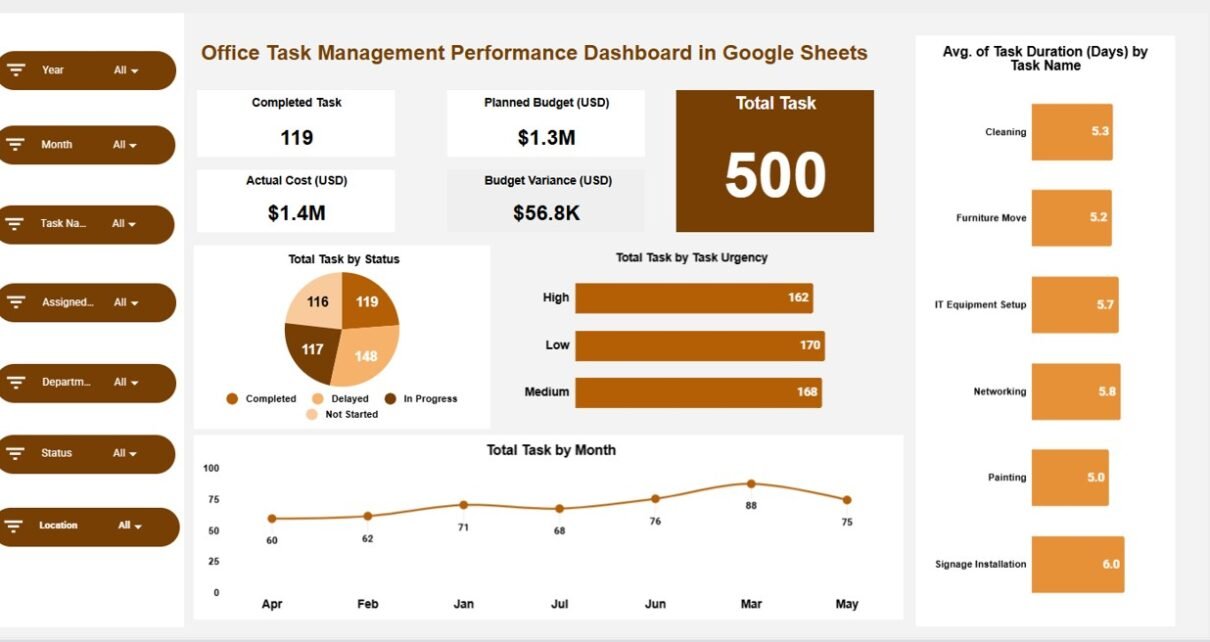
This ready-to-use dashboard converts task data into meaningful KPI cards, charts, and searchable insights—helping managers monitor task execution, control budgets, and improve productivity from one centralized Google Sheets file.Office Task Management Performance Dashboard in Google Sheets
What Is an Office Task Management Performance Dashboard in Google Sheets?
An Office Task Management Performance Dashboard in Google Sheets is an interactive tracking and analytics tool designed to monitor task volume, completion status, urgency levels, task duration, and budget performance.Office Task Management Performance Dashboard in Google Sheets
Instead of manually checking task sheets or email updates, this dashboard provides a real-time performance view with visual insights. As a result, managers, team leads, and operations teams can quickly identify delays, cost overruns, and workload imbalances.
Most importantly, Google Sheets keeps the dashboard collaborative, flexible, and easy to maintain without any advanced software.
Why Do Offices Need a Task Management Performance Dashboard?
Click to Buy Office Task Management Performance Dashboard in Google Sheets
Office teams often handle dozens or hundreds of ongoing tasks across departments, locations, and employees. Therefore, without a structured dashboard, teams struggle to answer key questions:
-
How many tasks are completed versus delayed?
-
Which tasks are high urgency?
-
Are we exceeding planned budgets?
-
Which departments or locations face delays?
-
Who is overloaded with tasks?
The Office Task Management Performance Dashboard solves these challenges by combining task tracking and performance analytics in one place.
Key Features of Office Task Management Performance Dashboard in Google Sheets
This dashboard is ready to use and organized into multiple analytical sections, each focused on a specific performance dimension.
Overview Sheet Tab – Executive Task Performance Snapshot
Click to Buy Office Task Management Performance Dashboard in Google Sheets
The Overview sheet provides a high-level summary of task and cost performance.
KPI Cards on the Overview Sheet
The following cards deliver instant insights:
-
Completed Task – Total number of completed tasks
-
Total Task – Total tasks recorded in the system
-
Planned Budget (USD) – Approved budget for all tasks
-
Actual Cost (USD) – Actual spending on tasks
-
Budget Variance (USD) – Difference between planned and actual costs
These KPI cards help decision-makers quickly assess workload, productivity, and cost efficiency.
Charts on the Overview Sheet
The Overview sheet includes key charts such as:
-
Total Task by Status
Shows distribution of tasks (Completed, In Progress, Delayed, Pending). -
Total Task by Task Urgency
Displays tasks by urgency level (High, Medium, Low). -
Average Task Duration (Days) by Task Name
Highlights tasks that consume more time. -
Total Task by Month
Shows monthly task volume trends.
These visuals offer a quick operational pulse of office activities.

Click to Buy Office Task Management Performance Dashboard in Google Sheets
Department Analysis – Performance by Department
The Department Analysis section focuses on how different departments perform.
Charts Included:
-
Completed vs. Delayed Task by Department
Identifies departments with execution challenges. -
Total Task by Department
Shows workload distribution across departments. -
Planned Budget vs. Actual Cost by Department
Highlights cost control efficiency. -
Medium vs. Low vs. High Task by Department
Analyzes urgency mix at department level.
This analysis helps leadership allocate resources more effectively.

Location Analysis – Task Performance by Location
The Location Analysis section breaks down task performance geographically.
Charts Included:
-
Total Task by Location
Shows where most tasks originate. -
Completed vs. Delayed Task by Location
Identifies performance bottlenecks by location. -
Planned Budget vs. Actual Cost by Location
Highlights location-wise budget performance. -
Medium vs. Low vs. High Task by Location
Shows urgency distribution across locations.
This insight supports better multi-location planning and control.

Click to Buy Office Task Management Performance Dashboard in Google Sheets
Assigned Analysis – Performance by Assigned Person
The Assigned Analysis focuses on individual accountability and workload balance.
Charts Included:
-
Completed vs. Delayed Task by Assigned To
Identifies high and low performers. -
Planned Budget vs. Actual Cost by Assigned To
Shows cost responsibility at individual level. -
Medium vs. Low vs. High Task by Assigned To
Highlights urgency pressure on team members.
This section helps managers distribute tasks fairly and reduce burnout.

Click to Buy Office Task Management Performance Dashboard in Google Sheets
Task Analysis – Performance by Task Name
The Task Analysis section evaluates performance at the task level.
Charts Included:
-
Completed vs. Delayed Task by Task Name
Identifies problematic tasks. -
Total Task by Task Name
Shows most frequently occurring tasks. -
Planned Budget vs. Actual Cost by Task Name
Highlights costly tasks. -
Medium vs. Low vs. High Task by Task Name
Measures urgency patterns for each task.
This analysis supports process improvement and task optimization.

Search Functionality – Find Tasks Instantly
The dashboard includes a powerful Search feature that allows users to:
-
Enter a Search Keyword
-
Choose a Field Name (Task Name, Department, Location, Assigned To, Status, etc.)
This enables instant task lookup without manual filtering.

Click to Buy Office Task Management Performance Dashboard in Google Sheets
Data Section – Structured Task Information
The Data section acts as the backend of the dashboard and includes fields such as:
-
Task Name
-
Department
-
Location
-
Assigned To
-
Task Status
-
Task Urgency
-
Task Start Date
-
Task End Date
-
Planned Budget
-
Actual Cost
-
Task Duration (Days)
-
Remarks
All KPI cards, charts, and searches automatically update based on this data.

Click to Buy Office Task Management Performance Dashboard in Google Sheets
How This Dashboard Improves Office Productivity
This dashboard helps organizations:
-
Track task completion and delays
-
Control budgets and reduce cost overruns
-
Balance workloads across teams
-
Identify recurring task bottlenecks
-
Improve accountability and transparency
As a result, offices achieve higher efficiency and better operational control.
Advantages of Office Task Management Performance Dashboard in Google Sheets
-
Ready-to-use and easy to customize
-
No expensive task management software needed
-
Real-time performance visibility
-
Supports multi-department and multi-location views
-
Ideal for managers and operations teams
Best Practices for Using the Office Task Management Dashboard
Click to Buy Office Task Management Performance Dashboard in Google Sheets
-
Keep task data updated daily or weekly
-
Define clear urgency and status rules
-
Review dashboard insights in weekly meetings
-
Monitor budget variance regularly
-
Use search instead of manual filtering
Conclusion
The Office Task Management Performance Dashboard in Google Sheets provides a structured, visual, and data-driven way to manage office tasks. Instead of relying on scattered task lists and manual reviews, teams gain a centralized performance control panel.
Because the dashboard combines KPI cards, detailed charts, search functionality, and structured data, it supports better planning, execution, and accountability across the organization.
Visit our YouTube channel to learn step-by-step video tutorials
Youtube.com/@NeotechNavigators
Watch the step-by-step video tutorial:
Click to Buy Office Task Management Performance Dashboard in Google Sheets