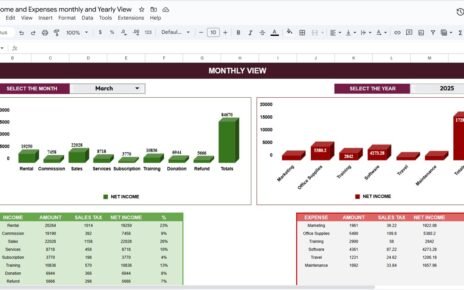
Managing office utility expenses without a structured reporting system often leads to budget overruns, delayed payments, and poor cost visibility. Electricity bills, internet charges, water usage, waste management fees, and other utilities generate large volumes of data every month. However, when this data remains scattered across invoices and spreadsheets, it becomes difficult to control costs and identify savings opportunities.Office Utility Cost Dashboard in Google Sheets
That is exactly why the Office Utility Cost Dashboard in Google Sheets becomes a powerful, ready-to-use analytics solution. This dashboard transforms raw utility invoice data into clear KPIs, interactive charts, and actionable insights—helping finance teams, facilities managers, and operations leaders make data-driven decisions.Office Utility Cost Dashboard in Google Sheets
What Is an Office Utility Cost Dashboard in Google Sheets?
An Office Utility Cost Dashboard in Google Sheets is an interactive reporting tool designed to track, analyze, and optimize utility expenses across departments, locations, providers, and time periods. Instead of manually reviewing invoices, users can instantly monitor total costs, budget vs actuals, variances, consumption quantities, and payment status from a single dashboard.Office Utility Cost Dashboard in Google Sheets
Because it is built entirely in Google Sheets, the dashboard is cloud-based, shareable, and easy to customize—without requiring advanced technical skills.Office Utility Cost Dashboard in Google Sheets
Key Features of the Office Utility Cost Dashboard
Click to Buy Office Utility Cost Dashboard in Google Sheets
🔹 Centralized KPI Overview
Track critical metrics such as:
-
Total Invoices
-
Total Utility Amount
-
Budget Amount
-
Variance Amount
-
Total Consumption Quantity
These KPIs provide an instant snapshot of overall utility spending performance.
🔹 Interactive Slicers & Filters
Analyze data dynamically using filters for:
-
Year
-
Month
-
Utility Type
-
Provider
-
Department
-
Workspace Type
-
Cost Center
-
State
-
Payment Status
All charts and KPIs update automatically based on selected filters.
🔹 Budget vs Actual Monitoring
Click to Buy Office Utility Cost Dashboard in Google Sheets
Compare budgeted utility costs with actual spending to:
-
Identify overspending areas
-
Control cost leakages
-
Improve financial forecasting accuracy
🔹 Department-Wise & Utility-Wise Analysis
Understand where money is being spent the most by analyzing:
-
Utility costs by department
-
Fixed charges by building
-
Discounts and taxes by category
-
Utility-specific consumption trends
Dashboard Sheet-Wise Explanation
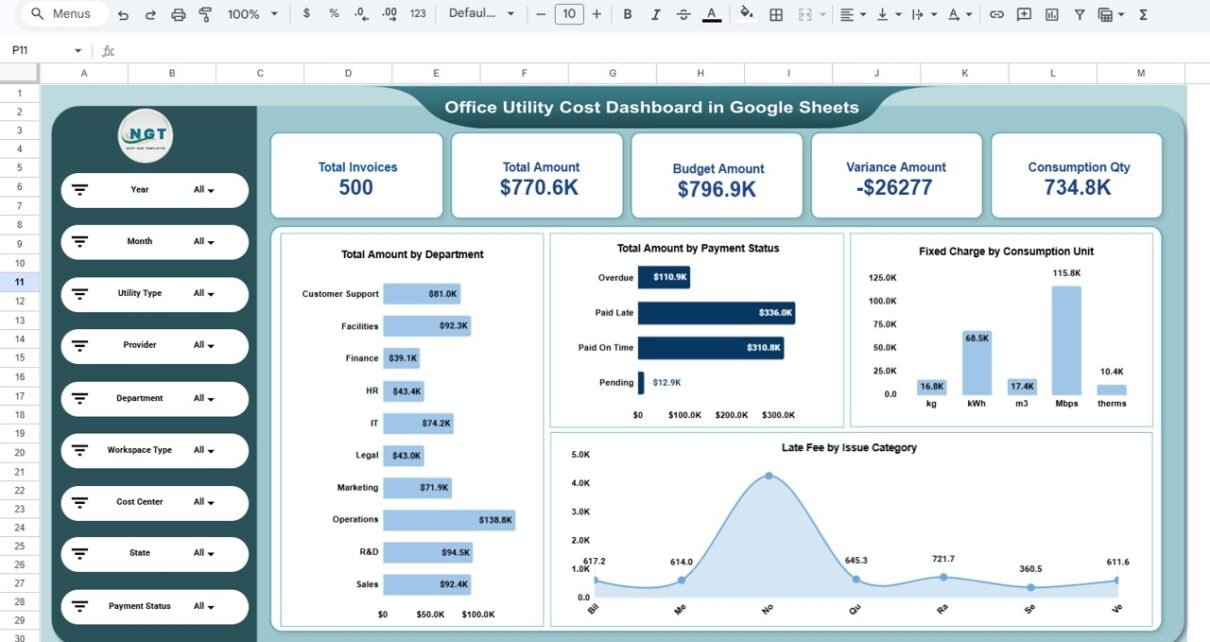
1️⃣ Overview Sheet
This is the main dashboard page providing a high-level summary of utility performance.
Key insights include:
-
Total invoices and total spending
-
Budget amount vs actual amount
-
Variance analysis
-
Consumption quantity overview
-
Total amount by department
-
Payment status distribution
-
Fixed charges by consumption unit
-
Late fees by issue category
This page is ideal for management-level reporting and quick decision-making.

Click to Buy Office Utility Cost Dashboard in Google Sheets
2️⃣ Utility Type Cost Analysis
This page focuses on utility-specific insights.
Analysis covered:
-
Total amount by utility type (Electricity, Internet, Water, Gas, Waste Management, Sewer)
-
Average rate per unit by utility
-
Taxes by utility type
-
Taxes by issue category
It helps identify which utilities are driving costs and where optimization is possible.

Click to Buy Office Utility Cost Dashboard in Google Sheets
3️⃣ Budget vs Actual Analysis
This page compares planned budgets with actual expenses.
Key visuals include:
-
Budget amount by utility type
-
Discounts by workspace type
-
Fixed charges by building
-
Total amount by issue category
Finance teams can use this page to strengthen cost control and improve budgeting strategies.

Click to Buy Office Utility Cost Dashboard in Google Sheets
4️⃣ Department Analysis
This page evaluates utility spending across departments.
Insights include:
-
Budget amount by department
-
Discount by department
-
Fixed charge by department
-
Total utility cost trend by department
It helps identify high-consumption departments and supports internal cost allocation decisions.

Click to Buy Office Utility Cost Dashboard in Google Sheets
5️⃣ Monthly Trends
This page tracks utility spending patterns over time.
Key metrics include:
-
Budget amount by month
-
Discount by month
-
Fixed charge by month
-
Total amount trend by month
Trend analysis enables proactive planning and early identification of unusual cost spikes.

Click to Buy Office Utility Cost Dashboard in Google Sheets
6️⃣ Data Table & Search Functionality
The dashboard includes a detailed, structured data table containing:
- Invoice ID
- Utility type
- Provider
- Account number
- Meter ID
- Building and floor
- Department and workspace
- Cost center
- Location details
- Invoice amounts and billing details
Advanced search allows users to filter records instantly by keyword and selected field.

Click to Buy Office Utility Cost Dashboard in Google Sheets
Who Can Benefit from This Dashboard?
-
Finance & Accounts Teams – Monitor budgets, variances, and payment status
-
Facilities Management – Track consumption and utility efficiency
-
Operations Teams – Control operational costs across locations
-
Admin Teams – Centralize invoice tracking and reporting
-
Management & Leadership – Gain visibility into cost drivers and trends
Advantages of Using This Dashboard
-
Eliminates manual utility reporting
-
Improves budget control and cost transparency
-
Identifies savings and optimization opportunities
-
Fully automated with pivot-based analytics
-
Cloud-based and easy to share in Google Sheets
Opportunities for Improvement
Click to Buy Office Utility Cost Dashboard in Google Sheets
-
Integrate automated invoice uploads
-
Add forecasting and trend prediction models
-
Include sustainability and energy efficiency KPIs
-
Connect with Google Forms for invoice data entry
Best Practices for Using the Dashboard
-
Update invoice data regularly
-
Validate utility units and rates monthly
-
Review budget vs actual variances frequently
-
Use filters for focused departmental analysis
-
Share insights with stakeholders for cost accountability
Final Thoughts
Click to Buy Office Utility Cost Dashboard in Google Sheets
The Office Utility Cost Dashboard in Google Sheets is a powerful, ready-to-use solution for organizations looking to gain full control over utility expenses. By converting raw invoice data into meaningful insights, this dashboard helps reduce costs, improve budgeting accuracy, and support smarter operational decisions—all within Google Sheets.
Visit our YouTube channel to learn step-by-step video tutorials
Youtube.com/@NeotechNavigators
Watch the step-by-step video tutorial: