Tracking operational performance without a structured KPI framework often leads to delayed decisions, inconsistent reporting, and unclear accountability. Many operations teams still rely on static spreadsheets that do not clearly show whether performance is improving or declining over time.
That is exactly where the Operations KPI Scorecard in Google Sheets becomes a powerful and practical solution. This ready-to-use template helps organizations monitor key operational KPIs with clear visuals, traffic-light indicators, and automatic month-to-date (MTD) and year-to-date (YTD) analysis—all within Google Sheets.
In this article, we will explain what the Operations KPI Scorecard is, how it works, its sheet-wise structure, key features, advantages, opportunities for improvement, and best practices.
What Is an Operations KPI Scorecard in Google Sheets?
An Operations KPI Scorecard in Google Sheets is a structured performance-tracking template designed to measure, monitor, and evaluate operational efficiency using key performance indicators (KPIs).
Instead of manually reviewing raw numbers, this scorecard visually highlights performance using:
-
Traffic-light color indicators
-
Up and down arrows for percentage change
-
Monthly (MTD) and yearly (YTD) performance views
Because it is built in Google Sheets, the scorecard remains flexible, collaborative, and easy to update.
Purpose of the Operations KPI Scorecard
Click to Buy Operations KPI Scorecard in Google Sheets
This scorecard is designed to help operations teams:
-
Track performance across critical operational KPIs
-
Compare actual results against targets
-
Monitor monthly and yearly trends
-
Identify underperforming areas quickly
-
Support data-driven operational decisions
Key Features of the Operations KPI Scorecard
-
Ready-to-use Google Sheets template
-
10 predefined operational KPIs
-
Month selector for dynamic reporting
-
MTD and YTD performance switching
-
Automatic percentage change calculation
-
Traffic-light indicators for quick insights
-
KPI trend analysis by KPI name
-
Centralized KPI definition and data input
Sheet-Wise Structure of the Scorecard
The Operations KPI Scorecard is organized into multiple structured worksheets, each serving a specific purpose.
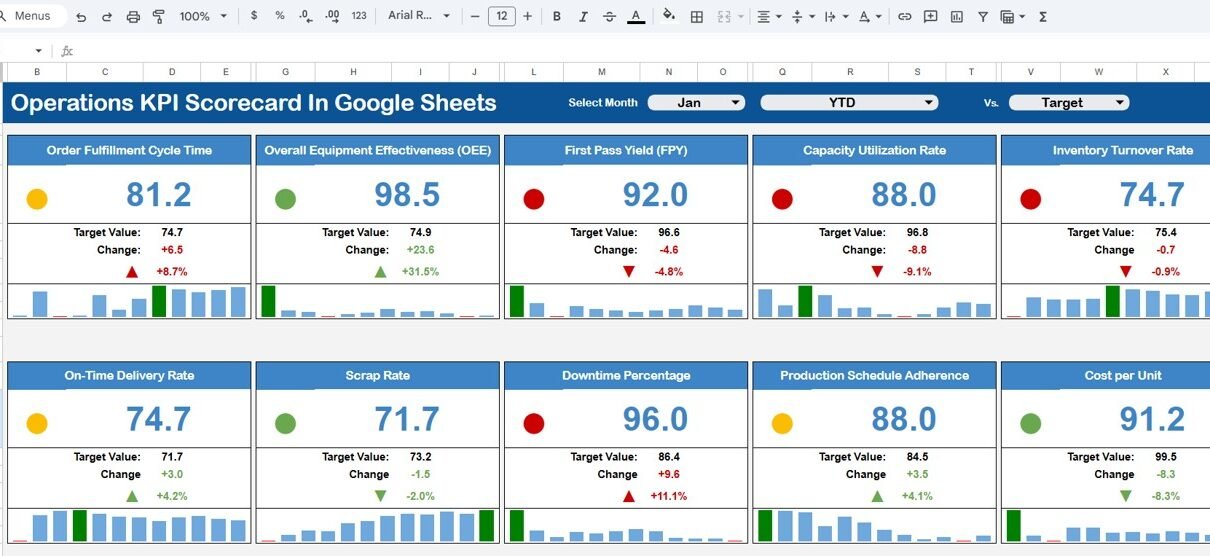
1. Dashboard Sheet (Main Scorecard)
Click to Buy Operations KPI Scorecard in Google Sheets
This is the primary scorecard view where all KPIs are displayed.
Key Highlights
-
Month dropdown at the top to select any month
-
Automatically refreshed KPI values based on selected month
-
10 operational KPIs displayed in a clean scorecard layout
Performance Metrics Displayed
For each KPI, the dashboard shows:
-
MTD Actual vs Target
-
MTD comparison with Previous Year
-
YTD Actual vs Target
-
YTD comparison with Previous Year
Traffic-light colors and up/down arrows instantly indicate whether performance is improving or declining.

Click to Buy Operations KPI Scorecard in Google Sheets
2. Trend Sheet
The Trend Sheet allows deeper KPI analysis over time.
Key Functionalities
-
KPI name dropdown (available in range C3)
-
Displays KPI Group, Unit, and KPI Type
-
Clearly shows whether the KPI is:
-
UTB (Upper the Better)
-
LTB (Lower the Better)
-
Insights Gained
This sheet helps users:
-
Understand KPI behavior over multiple months
-
Identify consistent improvement or decline
-
Analyze seasonal or cyclical trends

Click to Buy Operations KPI Scorecard in Google Sheets
3. KPI Definition Sheet
The KPI Definition sheet acts as the foundation of the scorecard.
Columns Included
-
KPI Name
-
KPI Group
-
Unit
-
Formula
-
KPI Definition
This ensures clarity and consistency across teams by clearly explaining what each KPI measures and how it is calculated.

Click to Buy Operations KPI Scorecard in Google Sheets
4. Data Input Sheet
The Data Input sheet is where users enter operational data.
Key Points
-
Simple and structured data entry
-
Supports monthly updates
-
Feeds all calculations and visuals automatically
Once data is entered, the dashboard, trends, and indicators update instantly.

Click to Buy Operations KPI Scorecard in Google Sheets
5. Colour Settings Sheet
The Colour Settings sheet allows customization of:
-
Traffic-light colors
-
Arrow indicators
-
Threshold ranges for KPI performance
This makes the scorecard adaptable to different organizational standards and branding guidelines.

Advantages of Operations KPI Scorecard in Google Sheets
-
Clear Performance Visibility
-
Instantly see which KPIs are meeting or missing targets
-
-
Time-Saving Reporting
-
No need for manual calculations or formatting
-
-
Standardized KPI Tracking
-
Consistent performance measurement across months
-
-
Collaborative & Cloud-Based
-
Easy sharing and real-time collaboration
-
-
Decision-Ready Insights
-
Supports faster and more confident operational decisions
-
Opportunities for Improvement
Click to Buy Operations KPI Scorecard in Google Sheets
-
Add More KPIs
-
Expand beyond 10 KPIs as operations grow
-
-
Department-Wise Views
-
Create separate scorecards for different operational units
-
-
Automation
-
Integrate with Google Forms or external systems for auto data capture
-
-
Advanced Trend Analysis
-
Add rolling averages or benchmark comparisons
-
Best Practices for Using the Operations KPI Scorecard
Click to Buy Operations KPI Scorecard in Google Sheets
-
Define KPIs Clearly
-
Keep formulas and definitions simple and standardized
-
-
Update Data Regularly
-
Maintain monthly discipline for accurate insights
-
-
Review MTD and YTD Together
-
Avoid focusing on short-term performance alone
-
-
Use Traffic Lights Proactively
-
Act early on red or declining indicators
-
-
Align KPIs with Business Goals
-
Ensure operational KPIs support strategic objectives
-
Who Should Use This Scorecard?
Click to Buy Operations KPI Scorecard in Google Sheets
This Operations KPI Scorecard is ideal for:
-
Operations Managers
-
Plant & Facility Managers
-
Process Improvement Teams
-
Business Analysts
-
Senior Leadership & Executives
-
SMEs and growing organizations
Final Thoughts
The Operations KPI Scorecard in Google Sheets is a simple yet powerful way to bring structure, clarity, and consistency to operational performance tracking. With dynamic month selection, MTD and YTD views, KPI trends, and visual indicators, this scorecard transforms raw operational data into actionable insights.
Visit our YouTube channel to learn step-by-step video tutorials
Youtube.com/@NeotechNavigators
Watch the step-by-step video tutorial: