Tracking performance in the pharmaceutical industry requires precision, compliance, and speed. However, when KPIs stay scattered across reports and spreadsheets, performance monitoring becomes slow and unclear. That is exactly why the Pharmaceutical KPI Scorecard in Google Sheets becomes a powerful, ready-to-use solution.
This Pharmaceutical KPI Scorecard in Google Sheets is designed as a monthly and yearly performance scorecard, allowing pharma teams to monitor key KPIs using traffic lights, trend arrows, and percentage change indicators—all in one structured view.
What Is a Pharmaceutical KPI Scorecard in Google Sheets?
Click to Buy Pharmaceutical KPI Scorecard in Google Sheets
A Pharmaceutical KPI Scorecard in Google Sheets is an interactive performance tracking template that measures and visualizes pharmaceutical KPIs for a selected month or year.
Instead of manually comparing numbers, users can instantly:
- Monitor KPI performance month-wise (MTD)
- Review yearly performance (YTD)
- Identify improving or declining KPIs
- Track performance using traffic-light indicators
- Analyze KPI trends over time
Because the scorecard is built in Google Sheets, it remains cloud-based, collaborative, and easy to update.
Key Highlights of This Pharmaceutical KPI Scorecard
- Ready-to-use Google Sheets template
- Monthly and Yearly KPI scorecard
- 10 critical pharmaceutical KPIs
- Dynamic Month dropdown
- MTD and YTD toggle
- Traffic light indicators
- Up/down arrows with % change
- KPI trend analysis
- KPI Coverage: 10 Key Pharmaceutical KPIs
This scorecard tracks 10 different pharmaceutical KPIs, which can be customized as per business needs.
Typical KPI examples include:
- Production Yield %
- Batch Rejection Rate
- On-Time Delivery %
- Inventory Turnover
- Manufacturing Cost per Unit
- Quality Compliance %
- Sales Growth %
- Order Fulfillment Rate
- Return Rate
- Regulatory Deviation Count
Each KPI is clearly defined with its unit, formula, and performance type.
How the Monthly KPI Scorecard Works
Click to Buy Pharmaceutical KPI Scorecard in Google Sheets
Month Selection
-
A Month dropdown is available at the top of the scorecard
-
Users can select any month
-
All KPI values update automatically for the selected month
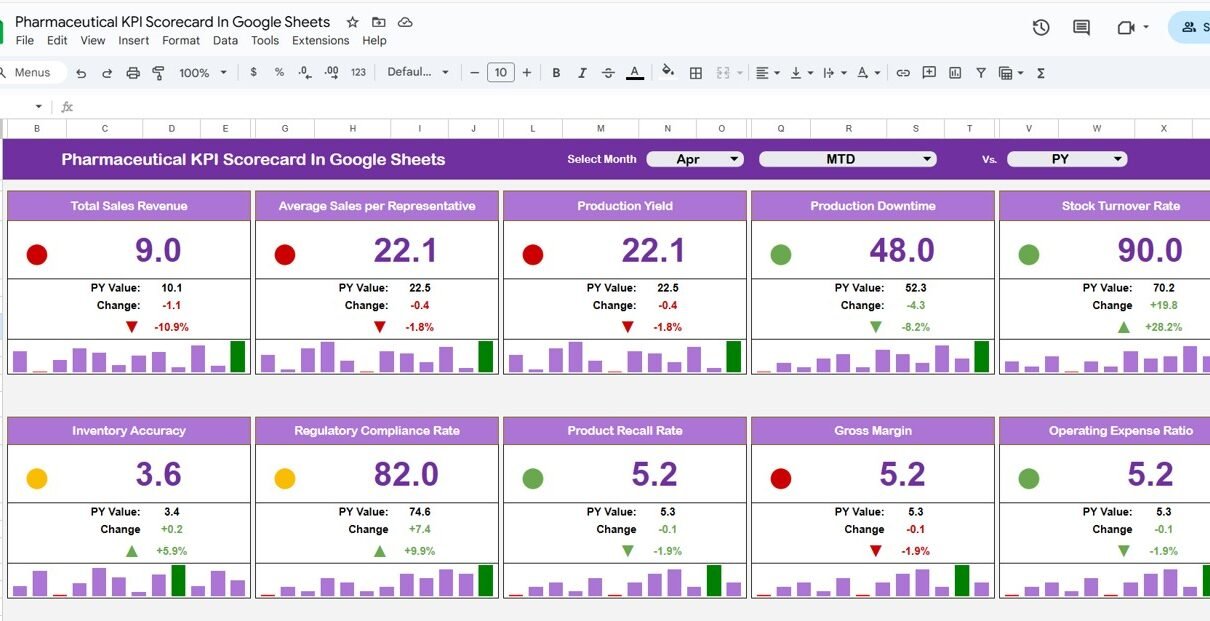
Performance Indicators
For each KPI, the scorecard displays:
-
Actual value
-
Target value
-
Percentage change
-
Up/down arrows for performance movement
-
Traffic lights for quick status identification
Green → Good performance
Amber → Needs attention
Red → Action required
MTD vs YTD Performance View
This scorecard allows users to switch between monthly and yearly views.
-
Click MTD to view Monthly KPI performance
-
Click YTD to view Year-to-Date KPI performance
This flexibility helps both operational teams and leadership review short-term execution and long-term trends.

Click to Buy Pharmaceutical KPI Scorecard in Google Sheets
Trend Sheet Tab
The Trend Sheet provides detailed KPI-level trend analysis.
Features of the Trend Sheet:
-
KPI selection dropdown at Cell C3
Displays:
- KPI Group
- Unit of KPI
- KPI Type (Lower the Better / Upper the Better)
- KPI Formula
- KPI Definition
Trend Analysis
-
KPI trend over time
-
Helps identify improvement or decline patterns
-
Supports proactive decision-making

Click to Buy Pharmaceutical KPI Scorecard in Google Sheets
KPI Definition Sheet Tab
The KPI Definition Sheet acts as a master reference.
Information Maintained:
- KPI Name
- KPI Group
- Unit
- Formula
- KPI Definition
- KPI Type (LTB / UTB)
This ensures KPI clarity, consistency, and standard interpretation across teams.

Click to Buy Pharmaceutical KPI Scorecard in Google Sheets
Data Input Sheet Tab
The Data Input Sheet is where users enter KPI data.
Key Points:
- Input monthly KPI values
- Structured layout for easy data entry
- Automatically feeds the scorecard and trend charts
- No manual calculations required
Because of this structure, the scorecard stays accurate and reliable.

Click to Buy Pharmaceutical KPI Scorecard in Google Sheets
Colour Settings Logic
The scorecard uses dynamic colour rules to highlight performance.
Colour Logic:
-
Green: KPI meets or exceeds target
-
Amber: KPI slightly below target
-
Red: KPI significantly below target
Arrow Indicators:
-
Up arrow: Performance improved
-
Down arrow: Performance declined
This visual logic enables instant performance interpretation.

Click to Buy Pharmaceutical KPI Scorecard in Google Sheets
Advantages of Pharmaceutical KPI Scorecard in Google Sheets
- Centralized KPI monitoring
- Visual performance tracking
- Easy monthly and yearly comparison
- Faster management reviews
- Cloud-based collaboration
- No complex BI tools required
- Fully customizable KPIs
Best Practices for Using This KPI Scorecard
Click to Buy Pharmaceutical KPI Scorecard in Google Sheets
- Define KPIs clearly in the KPI Definition sheet
- Update KPI data regularly
- Review traffic lights during monthly reviews
- Use trend analysis for root-cause identification
- Avoid tracking too many KPIs at once
- Keep targets realistic and measurable
Who Can Use This Scorecard?
This scorecard is ideal for:
- Pharmaceutical Operations Teams
- Quality & Compliance Teams
- Supply Chain Managers
- Manufacturing Heads
- Sales & Distribution Teams
- Senior Management
Conclusion
Click to Buy Pharmaceutical KPI Scorecard in Google Sheets
The Pharmaceutical KPI Scorecard in Google Sheets provides a simple yet powerful way to track pharmaceutical performance using monthly scorecards, traffic lights, trend arrows, and KPI trends. It helps organizations move from static reporting to insight-driven performance management.
Because it is ready to use, visual, and cloud-based, this KPI scorecard is a valuable tool for modern pharmaceutical organizations.
Visit our YouTube channel to learn step-by-step video tutorials
Youtube.com/@NeotechNavigators
Watch the step-by-step video tutorial: