Launching a new product involves multiple teams, tight timelines, and constant performance monitoring. Sales, revenue, profit margins, and regional performance all need close attention. However, when launch data spreads across multiple sheets or tools, decision-making slows down and insights get missed.
This is where a Product Launch Dashboard in Google Sheets becomes extremely valuable.
This ready-to-use dashboard helps business teams track product launch performance in real time. It converts raw sales data into clear charts and insights, making it easier to evaluate launch success and take corrective actions quickly.
In this article, we explain how the dashboard works, its charts, search functionality, advantages, and best practices.
What Is a Product Launch Dashboard in Google Sheets?
Click to Buy Product Launch Dashboard in Google Sheets
A Product Launch Dashboard is a centralized reporting tool that tracks key launch metrics such as units sold, revenue, profit margin, and target achievement. Instead of reviewing multiple reports, teams can view launch performance in one interactive dashboard.
Because this dashboard is built in Google Sheets, it provides:
- Real-time data updatesh
- Easy collaboration across teams
- Automatic chart refresh
- Cloud-based access
- No additional BI tool cost
This dashboard suits product managers, sales teams, marketing teams, and business leaders.
Key Features of the Product Launch Dashboard
This dashboard is ready to use and includes a Dashboard sheet and a Data input sheet, along with interactive charts and a smart search option.
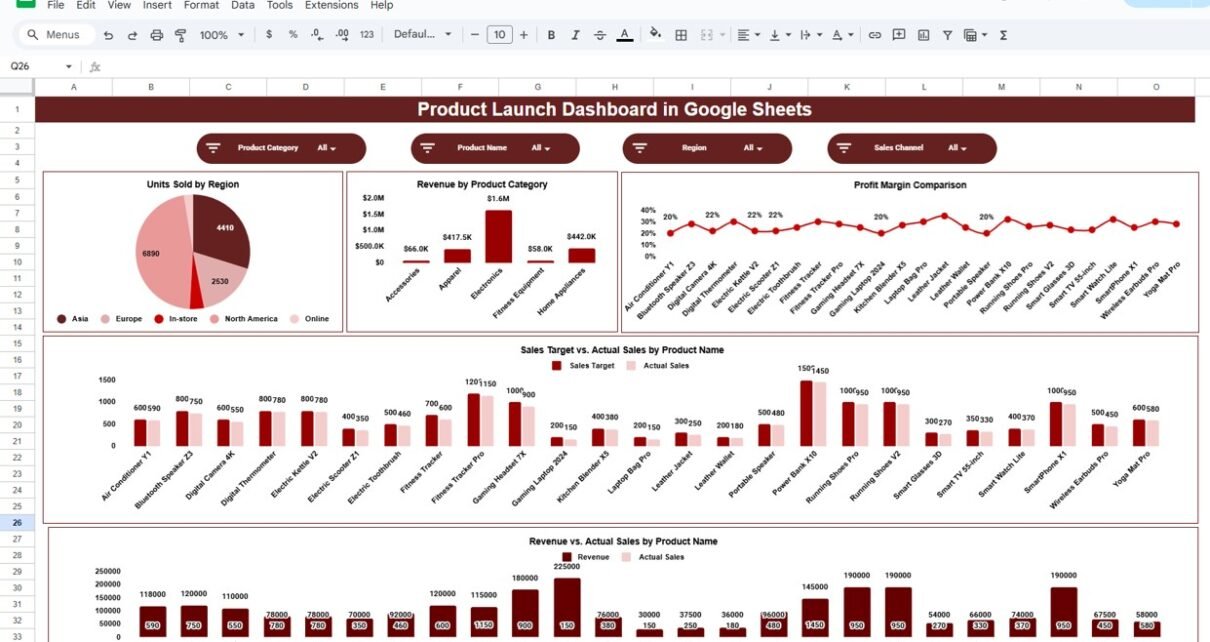
Dashboard Sheet Tab – Launch Performance Overview
The Dashboard Sheet acts as the main visual layer of the dashboard. It summarizes product launch performance using multiple business-focused charts.
Charts Included in the Product Launch Dashboard
Click to Buy Product Launch Dashboard in Google Sheets
Units Sold by Region
This chart shows how many units were sold across different regions.
It helps teams:
-
Identify high-performing regions
-
Compare regional demand
-
Improve regional sales strategies
Revenue by Product Category
This chart displays revenue contribution by product category.
It helps organizations:
-
Understand which categories drive revenue
-
Optimize category-level pricing
-
Focus marketing efforts effectively
Profit Margin Comparison
This chart compares profit margins across products or categories.
It helps decision-makers:
-
Identify profitable products
-
Control costs during launch
-
Improve pricing and margin strategy
Sales Target vs. Actual Sales by Product Name
This chart compares planned sales targets with actual sales.
It helps teams:
-
Measure launch success against goals
-
Identify underperforming products
-
Take quick corrective actions
Revenue vs. Actual Sales by Product Name
This chart compares expected revenue with actual sales results.
It helps businesses:
- Validate revenue forecasts
- Identify pricing or volume gaps
- Improve future launch planning

Click to Buy Product Launch Dashboard in Google Sheets
Search Feature – Search by Keyword and Field Name
The dashboard includes a smart search feature that allows users to quickly locate specific product or launch records.
You can search by:
- Product Name
- Region
- Product Category
- Launch Period
- Sales Status
By entering a Search Keyword and selecting the Field Name, the dashboard filters results instantly without manual scrolling.
This feature proves useful during:
- Launch performance reviews
- Management meetings
- Sales analysis
- Forecast validation

Click to Buy Product Launch Dashboard in Google Sheets
Data Input Sheet Tab
The Data Sheet serves as the input layer of the dashboard.
Here, you enter:
- Product Name
- Region
- Product Category
- Units Sold
- Revenue
- Cost
- Profit Margin
- Sales Target
Once data is updated, all dashboard charts refresh automatically.
Click to Buy Product Launch Dashboard in Google Sheets
Why Organizations Need a Product Launch Dashboard
Without a centralized dashboard, product launch tracking becomes fragmented and reactive. This dashboard helps organizations:
-
Monitor launch performance in real time
-
Track sales and revenue accurately
-
Measure target achievement
-
Improve decision-making speed
-
Align sales, marketing, and product teams
A single dashboard ensures clarity and accountability.
Advantages of the Product Launch Dashboard
-
Centralized product launch tracking
-
Clear sales and revenue visibility
-
Region-wise and product-wise analysis
-
Faster management decisions
-
Easy collaboration in Google Sheets
-
Cost-effective and scalable solution
Opportunities for Improvement
Click to Buy Product Launch Dashboard in Google Sheets
You can enhance this dashboard further by adding:
-
Marketing campaign impact analysis
-
Channel-wise sales tracking
-
Customer segment analysis
-
Daily launch performance tracking
-
Automated data import from CRM systems
These enhancements provide deeper launch insights.
Best Practices for Using the Product Launch Dashboard
-
Update launch data regularly
-
Set realistic sales and revenue targets
-
Review performance weekly during launch
-
Share insights with all stakeholders
-
Maintain consistent product naming
-
Protect data with proper access controls
Conclusion
Click to Buy Product Launch Dashboard in Google Sheets
A Product Launch Dashboard in Google Sheets provides a simple yet powerful way to track and analyze product launch performance. It replaces scattered reports with clear visuals, supports faster decisions, and helps teams stay aligned with launch goals. Because the dashboard is ready to use and cloud-based, teams can start tracking performance immediately without technical complexity.
For organizations aiming for successful and data-driven product launches, this dashboard becomes an essential business tool.
Frequently Asked Questions (FAQs)
1. Who should use this dashboard?
Product managers, sales teams, marketing teams, and leadership.
2. Can it track multiple products?
Yes, it supports multiple products and categories.
3. Is the dashboard customizable?
Yes, charts and fields can be modified easily.
4. Does it support target tracking?
Yes, it compares sales targets with actual results.
5. Is Google Sheets secure for business data?
Yes, with proper sharing and access permissions.
6. Does it require technical expertise?
No, basic Google Sheets knowledge is enough.
Visit our YouTube channel to learn step-by-step video tutorials
Youtube.com/@NeotechNavigators