Product returns directly affect profitability, customer satisfaction, inventory planning, and brand reputation. Therefore, businesses must track return patterns carefully and act quickly on insights. However, when return data stays scattered across reports or systems, teams struggle to identify root causes and trends.Product Return Rate KPI Dashboard in Google Sheets
That is exactly why a Product Return Rate KPI Dashboard in Google Sheets becomes an essential performance management tool.
This ready-to-use dashboard helps businesses monitor return rates, compare performance against targets, analyze trends, and improve product quality using clear KPIs and visual indicators. Moreover, it provides month-to-date (MTD) and year-to-date (YTD) insights with historical comparisons for smarter decisions.Product Return Rate KPI Dashboard in Google Sheets
In this article, you will learn what this dashboard is, how it works, its KPIs, advantages, opportunities for improvement, best practices, and frequently asked questions.Product Return Rate KPI Dashboard in Google Sheets
What Is a Product Return Rate KPI Dashboard in Google Sheets?
Click to Buy Product Return Rate KPI Dashboard in Google Sheets
A Product Return Rate KPI Dashboard in Google Sheets is an interactive performance tracking tool that measures how often customers return products and why those returns occur.
Instead of relying on manual calculations or static reports, this dashboard:
- Centralizes all return KPIs in one place
- Tracks MTD and YTD performance
- Compares Actual vs Target and Previous Year data
- Highlights performance using up/down arrows
- Supports fast decision-making
Because it runs in Google Sheets, teams can collaborate in real time without additional software.
Why Should Businesses Track Product Return KPIs?
Product returns indicate deeper issues such as quality defects, incorrect descriptions, shipping damage, or customer expectation gaps. Therefore, tracking return KPIs helps organizations:
- Reduce unnecessary return costs
- Improve product quality and packaging
- Enhance customer satisfaction
- Strengthen inventory planning
- Protect revenue and margins
- As a result, return tracking becomes a strategic activity rather than a reactive one.
Key Features of the Product Return Rate KPI Dashboard
Click to Buy Product Return Rate KPI Dashboard in Google Sheets
This dashboard is designed for clarity, consistency, and scalability.
Key Highlights
- Monthly slicer for instant analysis
- MTD and YTD performance tracking
- Target vs Actual comparison
- Previous Year comparison
- Conditional formatting with arrows
- Dedicated KPI trend analysis
- Structured data entry sheets
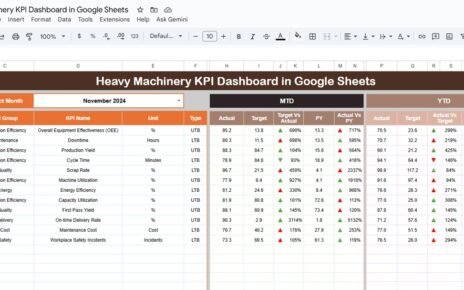
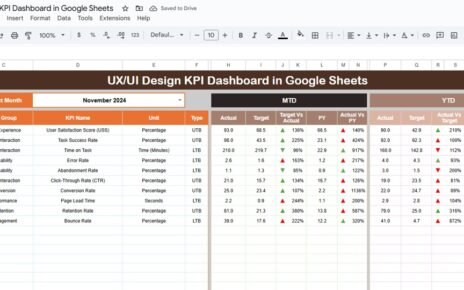
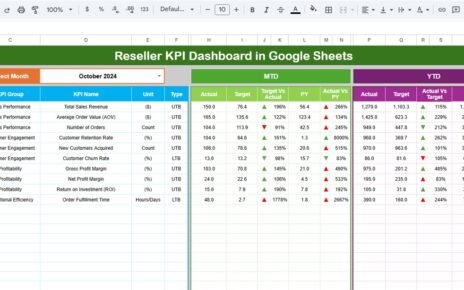
Dashboard Sheet Tab – Main KPI View
The Dashboard Sheet serves as the executive summary of product return performance.
Monthly Selection
-
Cell D3 allows you to select the month
-
All KPIs update automatically based on selection
MTD KPIs Displayed
For each KPI, the dashboard shows:
-
MTD Actual
-
MTD Target
-
MTD Previous Year
-
Target vs Actual %
-
PY vs Actual %
Conditional arrows instantly show improvement or decline.
YTD KPIs Displayed
Similarly, the dashboard tracks:
- YTD Actual
- YTD Target
- YTD Previous Year
- Target vs Actual %
- PY vs Actual %
This ensures long-term trend visibility.

Click to Buy Product Return Rate KPI Dashboard in Google Sheets
KPI Trend Sheet Tab – Deep KPI Analysis
The KPI Trend Sheet focuses on detailed KPI understanding.
Interactive KPI Selection
-
Select KPI name from dropdown in Cell C3
-
Dashboard updates automatically
Displayed KPI Details
- KPI Group
- KPI Unit
- KPI Type (Lower the Better / Upper the Better)
- KPI Formula
- KPI Definition
This sheet helps stakeholders clearly understand what each KPI measures.

Click to Buy Product Return Rate KPI Dashboard in Google Sheets
Actual Number Sheet Tab
This sheet captures real performance data.
How It Works
- Select the starting month of the year in Cell E1
- Enter MTD Actual and YTD Actual values
- All dashboards update automatically
This structured approach avoids calculation errors.

Click to Buy Product Return Rate KPI Dashboard in Google Sheets
Target Sheet Tab
This sheet stores planned benchmarks.
Data Entry
- Enter monthly MTD Target values
- Enter cumulative YTD Target values
- Targets remain consistent across analysis
- Targets allow teams to measure success objectively.

Click to Buy Product Return Rate KPI Dashboard in Google Sheets
Previous Year Number Sheet Tab
Historical performance supports meaningful comparisons.
Purpose
- Enter previous year MTD and YTD values
- Track year-over-year improvement or decline
- Identify recurring issues early

Click to Buy Product Return Rate KPI Dashboard in Google Sheets
KPI Definition Sheet Tab – Complete KPI List
This sheet acts as the KPI master reference.
Fields Included
- KPI Name
- KPI Group
- Unit
- Formula
- Definition
- KPI Type

Click to Buy Product Return Rate KPI Dashboard in Google Sheets
Advantages of Product Return Rate KPI Dashboard in Google Sheets
-
Centralized return performance tracking
-
Clear visibility of return drivers
-
Faster root cause analysis
-
Better quality and fulfillment decisions
-
Improved customer satisfaction
-
No expensive BI tools required
Opportunities for Improvement
Click to Buy Product Return Rate KPI Dashboard in Google Sheets
Businesses can enhance this dashboard by:
-
Adding reason-wise return breakdown
-
Integrating customer feedback scores
-
Linking returns with product categories
-
Automating data entry using Google Forms
-
Adding supplier or vendor-level KPIs
Best Practices for Using the Product Return KPI Dashboard
-
Update return data regularly
-
Review KPIs monthly and quarterly
-
Compare Actual vs Target consistently
-
Focus on root causes, not just numbers
-
Share insights with quality and logistics teams
-
Use trends to improve product design
Conclusion
Click to Buy Product Return Rate KPI Dashboard in Google Sheets
A Product Return Rate KPI Dashboard in Google Sheets transforms return tracking into a strategic advantage. It provides clear KPIs, visual comparisons, and historical insights that help businesses reduce costs, improve quality, and strengthen customer trust.
Because the dashboard is simple, collaborative, and scalable, it becomes a long-term solution for data-driven product management.
Frequently Asked Questions (FAQs)
1. Who should use this dashboard?
E-commerce teams, retail managers, quality teams, and operations leaders.
2. Can I customize KPIs?
Yes, all KPIs, targets, and formulas are fully customizable.
3. Does the dashboard support MTD and YTD tracking?
Yes, it supports both MTD and YTD with comparisons.
4. Is Google Sheets secure for business data?
Yes, with proper sharing and permission controls.
5. Can this dashboard scale for large businesses?
Yes, it works for small sellers and enterprise teams alike.
Visit our YouTube channel to learn step-by-step video tutorials
Youtube.com/@NeotechNavigators
Click to Buy Product Return Rate KPI Dashboard in Google Sheets