Google Sheets is a versatile tool that can be used for many tasks, including tracking the status of projects. One of the most visually engaging ways to represent project progress is through the use of a Progress Circle Chart. This type of chart visually showcases the completion percentage of a project in a circular format, making it easier for stakeholders to grasp the project’s status at a glance.
In this guide, we will walk you through how to create a dynamic Progress Circle Chart for Project Status in Google Sheets. Whether you’re managing multiple projects or just want to keep track of individual tasks, this chart can help you visualize progress efficiently. Additionally, it automatically updates as you change the percentage values, offering real-time updates for your data.
What is a Progress Circle Chart?
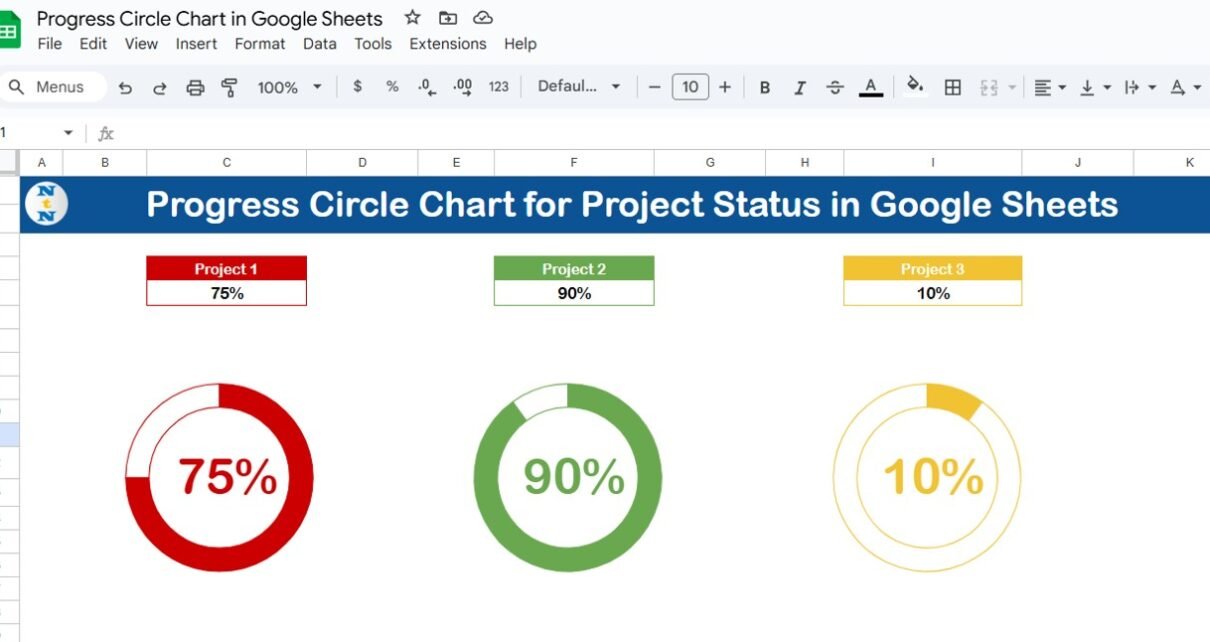
A Progress Circle Chart, also known as a Donut Chart, is a circular chart that is divided into sections to represent progress toward a specific goal. The chart typically displays the percentage of completion, with the filled section representing the completed portion of the task, and the remaining section representing the pending part.
For example, if a project is 75% complete, the chart will fill 75% of the circle and leave 25% empty. This makes it an excellent tool for tracking multiple projects or milestones in a simple, clear, and visual manner.
Why Use a Progress Circle Chart for Project Status?
There are several reasons why using a Progress Circle Chart for project status is beneficial:
- Clear Visualization: It provides a clear, visual representation of the completion percentage.
- Dynamic Updates: As soon as you update the percentage value, the chart updates automatically, saving time.
- Easy to Understand: Whether you are a team member or a stakeholder, everyone can quickly assess the progress of a project.
- Stylish Representation: It’s a great way to add a professional, visually appealing element to your project tracking.
Creating a Progress Circle Chart for Project Status in Google Sheets
To create a Progress Circle Chart in Google Sheets, follow these simple steps:
Step 1: Input Your Data
Start by creating a table with the project names and the corresponding completion percentages. Here’s an example of how your data might look:
Step 2: Create the Donut Chart
Now that you have your data ready, it’s time to create the donut chart:
- Select the data range (excluding headers).
- Go to Insert > Chart.
- In the Chart Editor, change the chart type to Donut Chart.
- Google Sheets will automatically create the donut chart for you. However, the default chart might not be fully dynamic yet.
Step 3: Customize the Chart for Progress
Now, let’s adjust the chart to show progress in a more meaningful way:
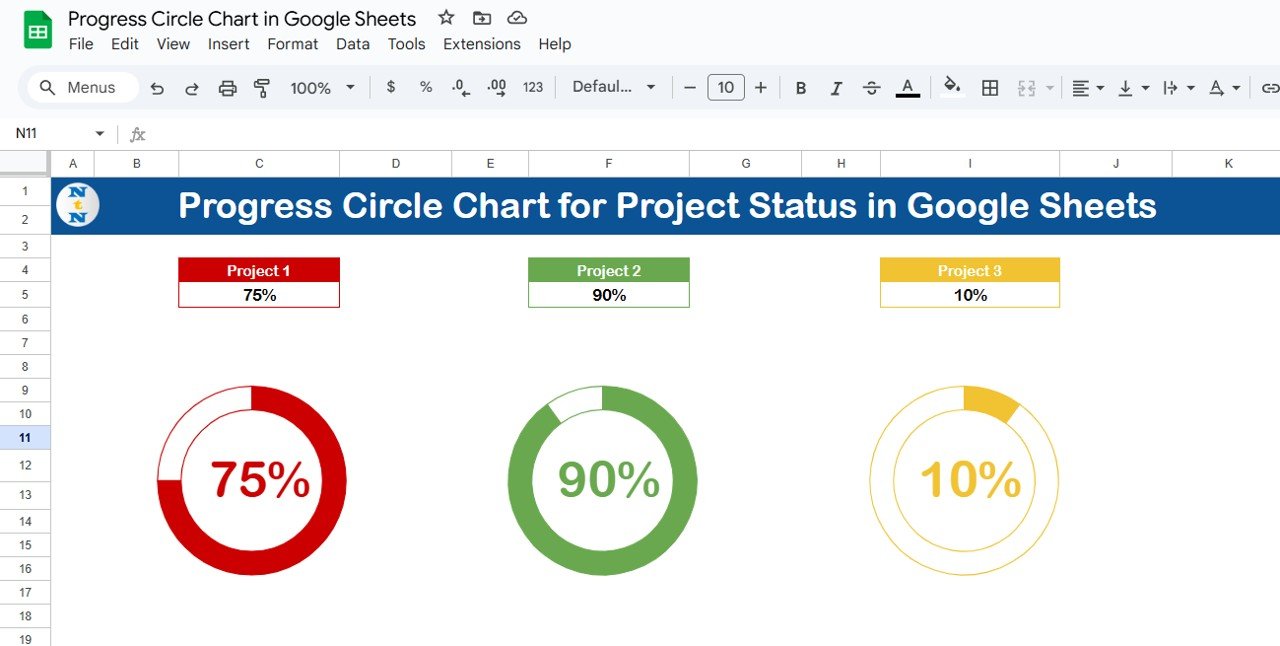
- Labeling the Chart: You can label each chart with the corresponding project name and progress percentage.
- Color Customization: Change the color of the sections to represent different projects more clearly. You might want to use a gradient color for better distinction.
- Make It Dynamic: Once the chart is set up, you can easily update the chart’s progress percentage. When you change the percentage in the data table, the chart updates automatically to reflect the new value.
Step 4: Formatting the Chart
To make your chart more polished:
- Adjust the size: Resize the chart so that it fits neatly in your sheet.
- Add labels: In the chart editor, under the “Customize” tab, choose to display labels inside or outside the chart. These labels can show either the percentage or the project name.
Advantages of Using a Progress Circle Chart for Project Status
Using a Progress Circle Chart for tracking project status comes with several advantages:
- Attractive and Professional: It provides a visually appealing way to represent progress, which makes the information more engaging.
- Instantly Updateable: As mentioned, the chart will automatically adjust when you change the data, making it a dynamic tool.
- Clear Communication: It simplifies project updates for stakeholders and team members, allowing them to see progress at a glance.
- Saves Time: There’s no need for manual updates. Simply adjust the percentage, and the chart takes care of the rest.
- Versatile Usage: Whether you’re tracking individual tasks, project phases, or overall project completion, the progress circle chart can be adapted to various needs.
Opportunities for Improvement in Progress Circle Charts
While the Progress Circle Chart is a fantastic tool for visualizing progress, there are always opportunities for improvement:
- Customization Options: While Google Sheets provides basic customization, you could benefit from adding more customization options such as multiple color bands for different stages of a project (e.g., green for completed, yellow for in progress, and red for pending).
- Integration with Other Data: The chart could integrate with other project management data, like deadlines or task lists, to give a more holistic view of the project’s status.
- Interactivity: Making the chart interactive, where users can click on segments to view detailed progress or updates, could improve usability.
Best Practices for Using Progress Circle Charts in Google Sheets
Here are some best practices to make the most out of your Progress Circle Chart:
- Keep Data Organized: Ensure that your data is organized clearly in your sheet. This will make it easier to update the chart as needed.
- Choose Appropriate Colors: Use colors that are easy to differentiate. If you have multiple projects, assigning each one a unique color will help avoid confusion.
- Update Regularly: Regular updates are key. Make sure to update the progress percentage frequently to reflect the true status of your project.
- Keep It Simple: Avoid cluttering the chart with too many details. Keep the focus on the percentage and project name.
- Use for Milestones: Break your project into stages or milestones, and use the chart to track progress through these phases.
Frequently Asked Questions (FAQ)
Q1: How do I make the progress circle chart update automatically?
A1: The chart updates automatically in Google Sheets whenever you change the percentage value in the table. As long as your data is entered correctly, the chart will adjust accordingly.
Q2: Can I use this chart for multiple projects?
A2: Yes, you can create a separate progress circle chart for each project or create one chart with multiple segments for each project. The chart will update as you change the percentages.
Q3: What is the benefit of using a donut chart over a regular pie chart?
A3: A donut chart allows for a clearer representation of progress by leaving space in the middle, which can also be used for labels or other useful information. It’s generally more aesthetically pleasing and easier to interpret.
Q4: Can I add labels inside the progress circle?
A4: Yes, in the Customize tab of the chart editor, you can choose to add labels inside or outside the circle. You can display the percentage or the project name as a label.
Q5: How can I use multiple progress circles on one sheet?
A5: You can create separate donut charts for each project or milestone and position them on the same sheet for easy comparison. Just ensure each chart has its own data range.
Conclusion
A Progress Circle Chart for Project Status in Google Sheets is a great tool for visually tracking the progress of your projects in a clear and dynamic manner. It’s easy to create, customizable, and automatically updates with any changes to the data. By following the best practices and continually improving your chart, you can enhance project tracking and communication within your team or organization.
Visit our YouTube channel to learn step-by-step video tutorials