Managing projects without clear visibility into cost, progress, delays, and performance creates serious risks. Teams often struggle with budget overruns, delayed tasks, contractor inefficiencies, and location-level cost leakage. Because of this, organizations increasingly rely on structured dashboards that show real-time project performance and cost control insights.Project Performance and Cost Control Dashboard in Google Sheets
A Project Performance and Cost Control Dashboard in Google Sheets offers a powerful, ready-to-use solution. It helps project managers, finance teams, PMOs, and leadership track costs, progress, delays, and variances across departments, contractors, and locations—all in one place.Project Performance and Cost Control Dashboard in Google Sheets
In this article, we explain how this dashboard works, what each sheet and chart represents, and how it helps organizations control costs while improving project delivery.Project Performance and Cost Control Dashboard in Google Sheets
What Is a Project Performance and Cost Control Dashboard in Google Sheets?
A Project Performance and Cost Control Dashboard is a centralized reporting tool that tracks project execution and financial performance together. Instead of using multiple spreadsheets or static reports, this dashboard combines:Project Performance and Cost Control Dashboard in Google Sheets
-
Budget vs actual cost tracking
-
Cost variance analysis
-
Task progress monitoring
-
Delay identification
-
Contractor performance analysis
-
Department-wise and location-wise insights
Because the dashboard runs in Google Sheets, it stays cloud-based, collaborative, and easy to maintain. Moreover, it updates automatically as soon as data changes.Project Performance and Cost Control Dashboard in Google Sheets
Why Use Google Sheets for Project Cost Control?
Click to Buy Project Performance and Cost Control Dashboard in Google Sheets
Google Sheets offers several advantages for project performance tracking:
-
Real-time collaboration across teams
-
Automatic recalculation of metrics
-
Easy customization without coding
-
Cost-effective alternative to heavy PM tools
-
Quick access from anywhere
As a result, project teams gain transparency and faster decision-making.
Dashboard Structure Overview
The Project Performance and Cost Control Dashboard in Google Sheets includes:
-
Overview Sheet with summary KPIs
-
Department Summary for internal analysis
-
Contractor Summary for vendor performance
-
Location Analysis for site-level insights
-
Search Functionality for fast record lookup
Each section focuses on a specific management perspective.
Overview Sheet Tab – Executive Summary
Click to Buy Project Performance and Cost Control Dashboard in Google Sheets
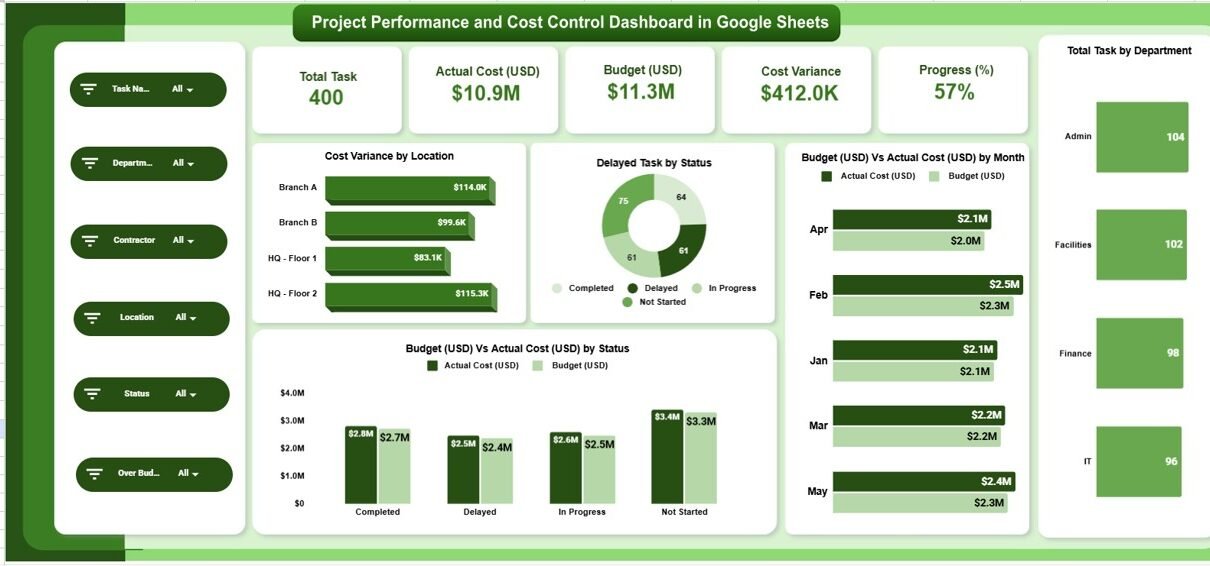
The Overview Sheet provides a high-level snapshot of project health. It combines KPI cards and visual charts for instant understanding.
KPI Cards on the Overview Sheet
These cards display the most critical project metrics:
1. Total Tasks
Shows the total number of tasks across all projects.
2. Actual Cost (USD)
Displays the total cost incurred so far.
3. Budget (USD)
Shows the approved project budget.
4. Cost Variance
Highlights the difference between budget and actual cost.
5. Progress (%)
Shows overall project completion percentage.
These KPIs help leadership understand project status within seconds.
Overview Charts Explained
Cost Variance by Location
This chart highlights which project locations exceed or stay within budget.
Delayed Task by Status
Shows how many tasks fall under different delay statuses.
Budget (USD) vs Actual Cost (USD) by Month
Tracks cost trends over time and highlights overspending periods.
Budget (USD) vs Actual Cost (USD) by Status
Compares cost efficiency across different task or project statuses.
These visuals allow teams to spot risks early and act quickly.

Click to Buy Project Performance and Cost Control Dashboard in Google Sheets
Department Summary – Internal Performance Tracking
The Department Summary section focuses on how different departments perform.
Key Charts in Department Summary
Budget vs Actual Cost by Department
Shows which departments control spending effectively.
Cost Variance by Department
Highlights departments causing budget overruns.
On-Time Task vs Delayed Task by Department
Measures delivery efficiency.
Progress (%) by Department
Tracks completion rates across departments.
This section helps leadership identify strong and weak performing teams.

Click to Buy Project Performance and Cost Control Dashboard in Google Sheets
Contractor Summary – Vendor Performance Control
Contractors often drive project cost and delivery risks. The Contractor Summary helps manage them effectively.
Charts in Contractor Summary
Budget vs Actual Cost by Contractor
Shows contractor-wise spending control.
Cost Variance by Contractor
Identifies contractors responsible for cost overruns.
Progress (%) by Contractor
Tracks work completion efficiency.
On-Time vs Delayed Tasks by Contractor
Highlights reliability and accountability.
With this insight, organizations can renegotiate contracts, improve oversight, or replace underperforming vendors.

Click to Buy Project Performance and Cost Control Dashboard in Google Sheets
Location Analysis – Site-Level Insights
Projects spread across multiple locations often face uneven performance. The Location Analysis section solves this problem.
Charts in Location Analysis
Cost Variance by Location
Identifies high-risk or over-budget locations.
Budget vs Actual Cost by Location
Compares planned and actual spending.
Progress (%) by Location
Shows which sites progress faster or slower.
On-Time vs Delayed Tasks by Location
Highlights operational efficiency at each site.
This analysis helps regional managers allocate resources more effectively.

Click to Buy Project Performance and Cost Control Dashboard in Google Sheets
Search Functionality – Search by Keyword and Field Name
The dashboard includes a powerful Search Tool that allows users to:
-
Search by project name
-
Filter by department
-
Find contractor records
-
Locate specific locations
-
Identify delayed or over-budget tasks
Users enter a Search Keyword and choose a Field Name, and the dashboard instantly filters matching records.
This feature saves time and improves productivity during reviews and audits.

Click to Buy Project Performance and Cost Control Dashboard in Google Sheets
Key Benefits of the Project Performance and Cost Control Dashboard
1. Real-Time Cost Visibility
Teams track budget usage without delays.
2. Early Risk Detection
Managers spot cost overruns and delays early.
3. Improved Accountability
Department, contractor, and location tracking increase responsibility.
4. Better Financial Control
Finance teams align spending with approved budgets.
5. Faster Decision-Making
Visual insights replace manual analysis.
6. Reduced Manual Reporting
Automated calculations save hours of work.
Advantages of Using This Dashboard
Click to Buy Project Performance and Cost Control Dashboard in Google Sheets
-
Centralized project performance view
-
Clear cost variance analysis
-
Strong budget discipline
-
Improved delivery timelines
-
Enhanced stakeholder reporting
-
Easy customization for any project type
This dashboard fits construction, IT, infrastructure, consulting, and operations projects.
Opportunities for Improvement in Project Cost Control
Organizations can enhance this dashboard further by adding:
-
Forecasting and cost projections
-
Risk scoring models
-
Earned Value Management (EVM) metrics
-
Automated alerts for budget overruns
-
SLA tracking for contractors
-
Phase-wise cost breakdown
These enhancements make project governance even stronger.
Best Practices for Using the Dashboard
Click to Buy Project Performance and Cost Control Dashboard in Google Sheets
Update data regularly
Accurate insights depend on fresh data.
Review variance weekly
Early reviews prevent escalation.
Monitor contractors closely
Contractor delays often impact cost.
Compare monthly trends
Trend analysis reveals hidden patterns.
Use dashboard during review meetings
Visuals improve clarity and alignment.
Conclusion
A Project Performance and Cost Control Dashboard in Google Sheets helps organizations manage projects with confidence. It combines financial control, progress tracking, and performance analysis in one powerful tool. Because the dashboard stays flexible, collaborative, and easy to use, teams can focus on execution instead of reporting.
With structured insights across departments, contractors, and locations, organizations reduce cost overruns, improve delivery timelines, and achieve stronger project outcomes.
Frequently Asked Questions (FAQs)
Click to Buy Project Performance and Cost Control Dashboard in Google Sheets
Who should use this dashboard?
Project managers, PMOs, finance teams, leadership, and operations managers.
Can this dashboard handle multiple projects?
Yes, you can track multiple projects in the same structure.
Does it require technical skills?
No, basic Google Sheets knowledge is enough.
Can I customize charts and KPIs?
Yes, the dashboard is fully customizable.
Is this suitable for construction and IT projects?
Yes, it works for any project-based environment.
Can I add forecasting later?
Yes, forecasting models can integrate easily.
Visit our YouTube channel to learn step-by-step video tutorials
Youtube.com/@NeotechNavigators
Watch the step-by-step video tutorial:
Click to Buy Project Performance and Cost Control Dashboard in Google Sheets