Public sector organizations must deliver services efficiently while maintaining transparency and accountability. However, tracking performance across departments and programs often becomes complex due to scattered data and manual reporting.
That is exactly why the Public Sector KPI Scorecard in Google Sheets becomes a powerful solution.
This ready-to-use scorecard helps public sector teams track key performance indicators using a clear, visual, and structured monthly and yearly scorecard. In this article, you will learn how the scorecard works, what features it offers, and how to use it effectively to improve performance monitoring.
What Is a Public Sector KPI Scorecard in Google Sheets?
Click to Buy Public Sector KPI Scorecard In Google Sheets
A Public Sector KPI Scorecard in Google Sheets is a performance tracking template designed specifically for government departments, public institutions, and regulatory bodies.
Instead of reviewing long reports, this scorecard shows:
-
KPI performance at a glance
-
Monthly and yearly comparisons
-
Visual traffic-light indicators
-
Trend and definition views
Because it is built in Google Sheets, it supports easy sharing, collaboration, and quick updates.
Why Do Public Sector Organizations Need a KPI Scorecard?
Public sector teams must justify outcomes, budgets, and service quality. However, without a structured scorecard, performance tracking becomes slow and unclear.
Common Challenges Without a KPI Scorecard
-
No clear performance visibility
-
Manual KPI tracking
-
Difficult month-to-month comparison
-
Limited accountability
-
Slow reporting cycles
Therefore, a Public Sector KPI Scorecard brings structure, clarity, and consistency to performance monitoring.
Overview of Public Sector KPI Scorecard in Google Sheets
Click to Buy Public Sector KPI Scorecard In Google Sheets
This scorecard is a ready-to-use Google Sheets template designed to track 10 key KPIs.
Key Highlights
-
Monthly KPI scorecard
-
YTD performance view
-
Automatic traffic light color changes
-
Up and down arrow indicators
-
KPI trend analysis
-
Centralized KPI definitions
Most importantly, users can switch months easily and see instant updates across the scorecard.
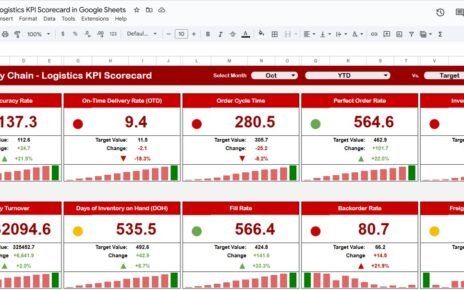
Scorecard Dashboard: How Does the Main KPI Scorecard Work?
The Scorecard Dashboard is the main reporting sheet.
Month Selection
-
A Month dropdown is available at the top
-
Users can select any month
-
All KPI values update automatically
This makes the scorecard truly dynamic and interactive.

Click to Buy Public Sector KPI Scorecard In Google Sheets
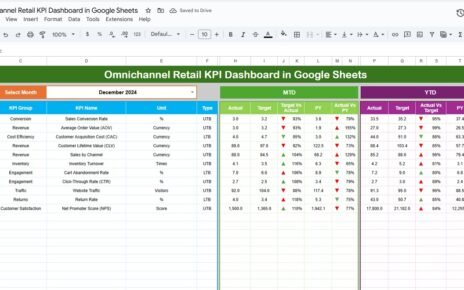
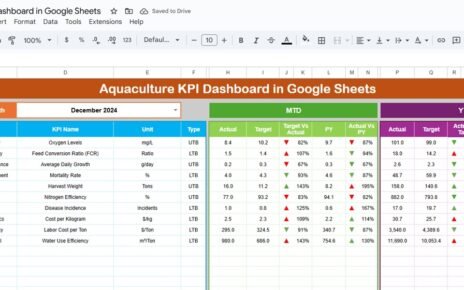
How Are KPI Results Displayed on the Dashboard?
The dashboard displays 10 KPIs with visual performance indicators.
KPI Performance Indicators
-
MTD (Month-to-Date) view
-
YTD (Year-to-Date) view
-
Target vs Actual comparison
-
Percentage change indicators
-
Traffic light colors (Green, Amber, Red)
-
Up and Down arrows
Users can:
-
Click MTD to view monthly performance
-
Click YTD to view yearly performance
As a result, performance reviews become faster and clearer.
Trend Sheet Tab: How Can You Analyze KPI Trends?
The Trend Sheet tab allows users to analyze individual KPIs in detail.
Key Features of Trend Sheet
-
KPI selection dropdown at Cell C3
-
Automatic display of:
- KPI Group
- KPI Unit
- KPI Type (Upper the Better / Lower the Better)
This sheet helps users understand how KPIs behave over time, not just current results.

Click to Buy Public Sector KPI Scorecard In Google Sheets
KPI Definition Sheet Tab: Why Is It Important?
The KPI Definition Sheet ensures clarity and governance.
Information Captured in KPI Definition Sheet
-
KPI Name
-
KPI Group
-
Unit
-
Formula
-
KPI Definition
Because of this sheet:
-
KPIs remain standardized
-
Teams avoid confusion
-
New users understand KPIs quickly

Click to Buy Public Sector KPI Scorecard In Google Sheets
Data Input Sheet Tab: Where Do You Enter KPI Data?
The Data Input Sheet is used for entering KPI values.
How This Sheet Works
-
Input monthly KPI data
Data feeds automatically into:
- Dashboard
- Trend sheet
- Scorecard visuals
This separation of input and reporting improves accuracy and control.

Click to Buy Public Sector KPI Scorecard In Google Sheets
Colour Settings: How Are Traffic Lights Managed?
The scorecard includes Color Settings for performance indicators.
Color Logic
-
Green = Good performance
-
Amber = Warning / Needs attention
-
Red = Poor performance
Colors change automatically based on KPI performance and direction (LTB or UTB).

Click to Buy Public Sector KPI Scorecard In Google Sheets
Advantages of Public Sector KPI Scorecard in Google Sheets
-
Ready-to-use template
-
Clear monthly and yearly tracking
-
Visual traffic-light indicators
-
Simple and user-friendly
-
Google Sheets collaboration
-
No complex tools required
-
Improves transparency and accountability
Best Practices for Public Sector KPI Scorecard
Click to Buy Public Sector KPI Scorecard In Google Sheets
-
Define KPIs clearly in the KPI Definition sheet
-
Update data regularly
-
Review both MTD and YTD views
-
Use traffic lights for quick reviews
-
Share scorecard with leadership teams
-
Keep KPIs aligned with policy goals
Conclusion: Why Public Sector KPI Scorecard in Google Sheets Matters
The Public Sector KPI Scorecard in Google Sheets helps organizations move from manual reporting to visual, data-driven performance management.
Because it combines monthly tracking, yearly analysis, trend insights, and clear definitions, this scorecard becomes a reliable tool for monitoring public sector performance.
If you want a simple, transparent, and effective KPI tracking solution, this ready-to-use scorecard is an excellent choice.
Frequently Asked Questions (FAQs)
Click to Buy Public Sector KPI Scorecard In Google Sheets
What is the main purpose of this scorecard?
It tracks public sector KPIs using a monthly and yearly scorecard.
Can I change the KPIs?
Yes, all KPIs are fully customizable.
Does it support MTD and YTD analysis?
Yes, users can switch between MTD and YTD views.
Is this suitable for government departments?
Yes, it is designed specifically for public sector use.
Can multiple users access the scorecard?
Yes, Google Sheets supports real-time collaboration.
Visit our YouTube channel to learn step-by-step video tutorials
Youtube.com/@NeotechNavigators
Watch the step-by-step video tutorial: