Regulatory and statutory compliance plays a critical role in every organization, regardless of industry or size. Companies must comply with labor laws, tax regulations, environmental rules, safety standards, financial reporting requirements, and many other statutory obligations. However, managing compliance manually through emails, registers, and scattered spreadsheets often leads to missed deadlines, penalties, audit issues, and reputational damage.Regulatory & Statutory Compliance Dashboard in Google Sheets
That is exactly why a Regulatory & Statutory Compliance Dashboard in Google Sheets becomes an essential tool. This ready-to-use dashboard helps organizations track, monitor, and analyze all compliance activities in one centralized, visual, and easy-to-manage system.Regulatory & Statutory Compliance Dashboard in Google Sheets
What Is a Regulatory & Statutory Compliance Dashboard in Google Sheets
Click to Buy Regulatory & Statutory Compliance Dashboard in Google Sheets
A Regulatory & Statutory Compliance Dashboard is a centralized reporting and monitoring system designed to track compliance requirements, due dates, priorities, statuses, and performance scores. It converts raw compliance data into meaningful visuals, KPIs, and insights.Regulatory & Statutory Compliance Dashboard in Google Sheets
Because the dashboard is built in Google Sheets, it offers:
- Real-time updates
- Easy collaboration across departments
- Cloud-based access from anywhere
- Automated calculations
- Visual charts and scorecards
- No dependency on expensive compliance software
This dashboard ensures that compliance tasks remain visible, structured, and actionable throughout the year.
Why Do Organizations Need a Compliance Dashboard?
Organizations face increasing regulatory pressure every year. At the same time, compliance requirements keep expanding across departments and geographies. Without a proper tracking system, teams struggle to answer questions like:
-
How many compliances are pending?
-
Which compliances are delayed?
-
Which departments show the highest risk?
-
Are high-priority compliances handled on time?
-
How does compliance performance change month by month?
A Regulatory & Statutory Compliance Dashboard answers all these questions instantly and supports proactive compliance management.
Overview of the Dashboard Structure
Click to Buy Regulatory & Statutory Compliance Dashboard in Google Sheets
Each section provides a different analytical perspective while using the same underlying compliance data.
Overview Sheet Tab – High-Level Compliance Summary
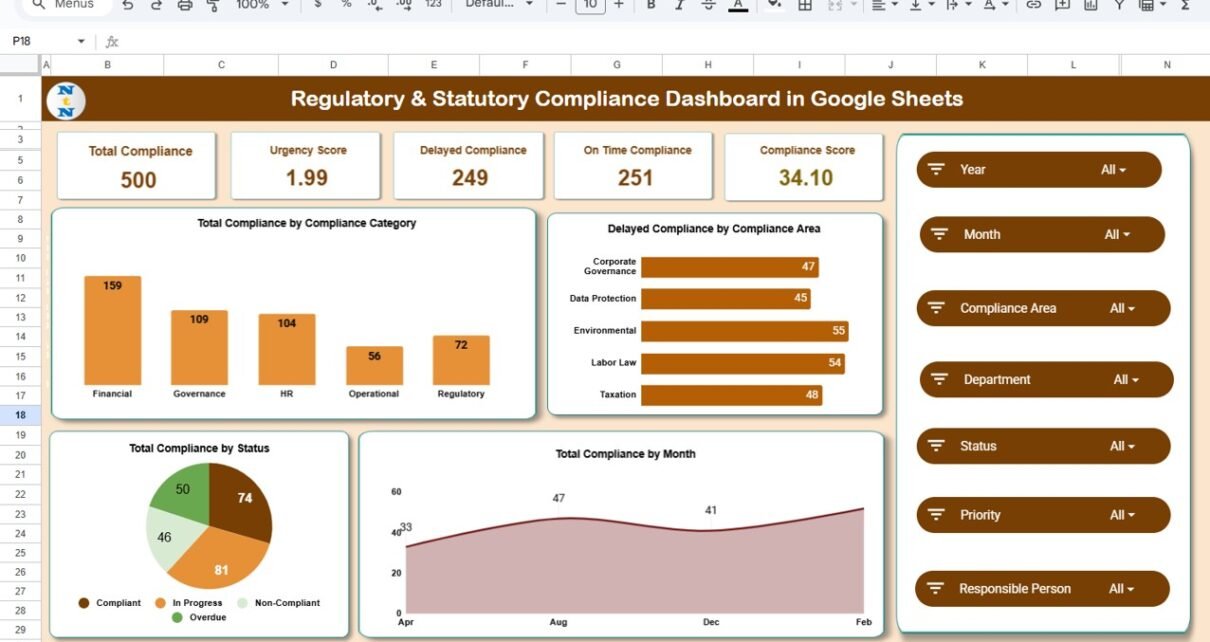
The Overview Sheet Tab acts as the control center of the entire dashboard. It provides instant visibility into overall compliance health using KPI cards and summary charts.
KPI Cards in the Overview Sheet
The dashboard displays the following KPI cards:
1. Total Compliance
Shows the total number of compliance obligations tracked in the system.
This card gives an instant understanding of compliance workload.
2. Urgency Score
Represents the overall urgency level of compliance items based on priority and due dates.
A higher urgency score signals increased compliance risk.
3. Delayed Compliance
Shows the number of compliances that missed deadlines.
This KPI helps teams focus on corrective actions.
4. On-Time Compliance
Displays the count of compliances completed within deadlines.
A higher value reflects strong compliance discipline.
5. Compliance Score
Represents overall compliance performance using a weighted calculation of on-time vs delayed tasks.
This score helps leadership track compliance maturity over time.
Charts in the Overview Sheet
The overview section also includes multiple charts that provide immediate insights.
1. Total Compliance by Compliance Category
This chart shows how compliances distribute across categories such as:
- Labor Law
- Tax
- Finance
- Environmental
- Safety
- Corporate Governance
It helps identify which regulatory areas require more effort.
2. Delayed Compliance by Compliance Area
This chart highlights compliance areas with the highest delays.
It supports targeted risk mitigation and corrective planning.
3. Total Compliance by Month
This chart shows monthly compliance volume trends.
It helps teams prepare for peak compliance months.
4. Total Compliance by Status
Displays compliance distribution by status, such as:
- Completed
- Pending
- Delayed
- In Progress
This chart provides a clear snapshot of current compliance health.

Click to Buy Regulatory & Statutory Compliance Dashboard in Google Sheets
Department Analysis Section
Compliance responsibility often spreads across departments. This section helps management evaluate departmental performance.
Charts in Department Analysis
1. Total Compliance by Department
Shows how many compliance items each department handles.
It helps balance workload distribution.
2. On-Time Compliance by Department
Highlights departments with strong compliance discipline.
It also reveals departments that need process improvements.
3. Compliance Score by Department
Provides a comparative compliance score across departments.
Leadership can use this metric during reviews and audits.

Click to Buy Regulatory & Statutory Compliance Dashboard in Google Sheets
Priority Analysis Section
Not all compliances carry equal risk. Some requirements demand immediate attention due to penalties or legal consequences.
Charts in Priority Analysis
1. Total Compliance by Priority
Shows compliance volume across priority levels such as:
-
High
-
Medium
-
Low
2. On-Time Compliance by Priority
Helps assess how effectively high-priority compliances are managed.
3. Compliance Score by Priority
Highlights whether urgent compliances receive adequate focus.

Click to Buy Regulatory & Statutory Compliance Dashboard in Google Sheets
Compliance Area Analysis Section
This section evaluates compliance performance by regulatory or functional area.
Charts in Compliance Area Analysis
1. Total Compliance by Compliance Area
Shows compliance distribution across different areas.
2. On-Time Compliance by Compliance Area
Highlights which compliance areas consistently meet deadlines.
3. Compliance Score by Compliance Area
Helps identify high-risk regulatory domains.

Click to Buy Regulatory & Statutory Compliance Dashboard in Google Sheets
Monthly Trends Section
Tracking compliance trends over time helps organizations improve processes and forecasting.
Charts in Monthly Trends
1. Total Compliance by Month
Displays month-wise compliance workload trends.
2. On-Time Compliance by Month
Shows improvements or declines in compliance execution.
3. Compliance Score by Month
Helps track long-term compliance performance and maturity.

Click to Buy Regulatory & Statutory Compliance Dashboard in Google Sheets
Search Functionality – Quick Record Lookup
The dashboard includes a Search Feature that allows users to find specific compliance records instantly.
Search Options
-
Search by Keyword
-
Search by Field Name (Department, Compliance Area, Priority, Status, Owner, etc.)
This feature supports:
-
Faster audits
-
Quick compliance checks
-
Management queries
-
Internal reviews

Click to Buy Regulatory & Statutory Compliance Dashboard in Google Sheets
Data Sheet – Structured Regulatory & Statutory Compliance Dashboard in Google Sheets
The underlying Data Sheet stores all compliance records in a structured format, including:Regulatory & Statutory Compliance Dashboard in Google Sheets
- Compliance ID
- Compliance Category
- Compliance Area
- Department
- Priority
- Due Date
- Status
- Completion Date
- Owner
- Remarks
This structured design ensures accurate reporting and smooth dashboard performance.
Advantages of the Regulatory & Statutory Compliance Dashboard in Google Sheets
Click to Buy Regulatory & Statutory Compliance Dashboard in Google Sheets
Centralized Compliance Tracking
All compliance activities stay in one place.
Improved Visibility
Teams see risks and delays instantly.
Better Accountability
Clear ownership reduces missed deadlines.
Audit Readiness
Quick access to compliance history supports audits.
Reduced Compliance Risk
Early identification of delays prevents penalties.
Cost-Effective Solution
Google Sheets eliminates expensive compliance tools.
Opportunities for Improvement
Organizations can further enhance the dashboard by adding:
- Automated due-date reminders
- Escalation alerts for delayed compliances
- SLA tracking
- Document attachment links
- Risk scoring models
- Year-over-year compliance comparison
These enhancements strengthen compliance governance.
Best Practices for Using the Regulatory & Statutory Compliance Dashboard in Google Sheets
Click to Buy Regulatory & Statutory Compliance Dashboard in Google Sheets
-
Update compliance status regularly
-
Assign clear compliance owners
-
Review delayed compliances weekly
-
Focus on high-priority compliance first
-
Use compliance scores during management reviews
-
Restrict editing rights to maintain data accuracy
Conclusion
A Regulatory & Statutory Compliance Dashboard in Google Sheets transforms compliance management from a reactive task into a proactive, structured, and data-driven process. With real-time insights, department-wise analysis, priority tracking, and monthly trends, organizations gain complete control over their compliance landscape.Regulatory & Statutory Compliance Dashboard in Google Sheets
Because the dashboard is ready to use, flexible, and easy to maintain, it suits organizations of all sizes. By adopting this dashboard, businesses reduce compliance risk, improve accountability, and stay audit-ready throughout the year.Regulatory & Statutory Compliance Dashboard in Google Sheets
Frequently Asked Questions (FAQs)
Click to Buy Regulatory & Statutory Compliance Dashboard in Google Sheets
Who should use this compliance dashboard?
Compliance teams, HR, finance, legal, internal audit, and management teams.
Can this dashboard handle multiple compliance categories?
Yes, it supports unlimited compliance categories and areas.
Is this dashboard suitable for audits?
Yes, it provides structured records and historical tracking.
Can I customize departments and priorities?
Yes, the dashboard is fully customizable.
Does it support multi-year tracking?
Yes, you can extend it easily for multiple years.
Do I need advanced technical skills to use it?
No, basic Google Sheets knowledge is sufficient.Regulatory & Statutory Compliance Dashboard in Google Sheets
Visit our YouTube channel to learn step-by-step video tutorials
Youtube.com/@NeotechNavigators
Watch the step-by-step video tutorial:
Click to Buy Regulatory & Statutory Compliance Dashboard in Google Sheets