
When working with data, cleaning and transforming it before analysis is absolutely crucial. One of the most common tasks in this process is removing unnecessary columns. Thankfully, Power Query in Power BI makes this task super easy and efficient. By trimming down your datasets, you can improve both performance and usability. In this guide, we’ll walk you through the process of removing columns in Power Query and explain why it’s such an important step for effective data management.
Why Should You Removing Columns in Power Query?
Before diving into the steps, let’s explore why removing unnecessary columns can benefit your work:
- Improves Performance: Datasets with too many irrelevant or redundant columns can slow down your reports. By removing unnecessary columns, you speed up data processing, ensuring smoother Power BI reports.
- Simplifies Data Analysis: Keeping only the columns that matter makes analysis easier. It also helps in creating clearer visualizations and writing simpler formulas.
- Reduces Clutter: A smaller dataset is a cleaner dataset. By minimizing unnecessary columns, you reduce confusion and make the data more manageable.
- Enhances Data Modeling: Removing unwanted columns helps focus your data model on what’s essential, leading to more efficient and streamlined modeling.
How to Remove Columns in Power Query
Power Query offers several ways to remove columns, whether you’re dealing with one, many, or even using M code for more advanced control. Let’s break it down step by step.
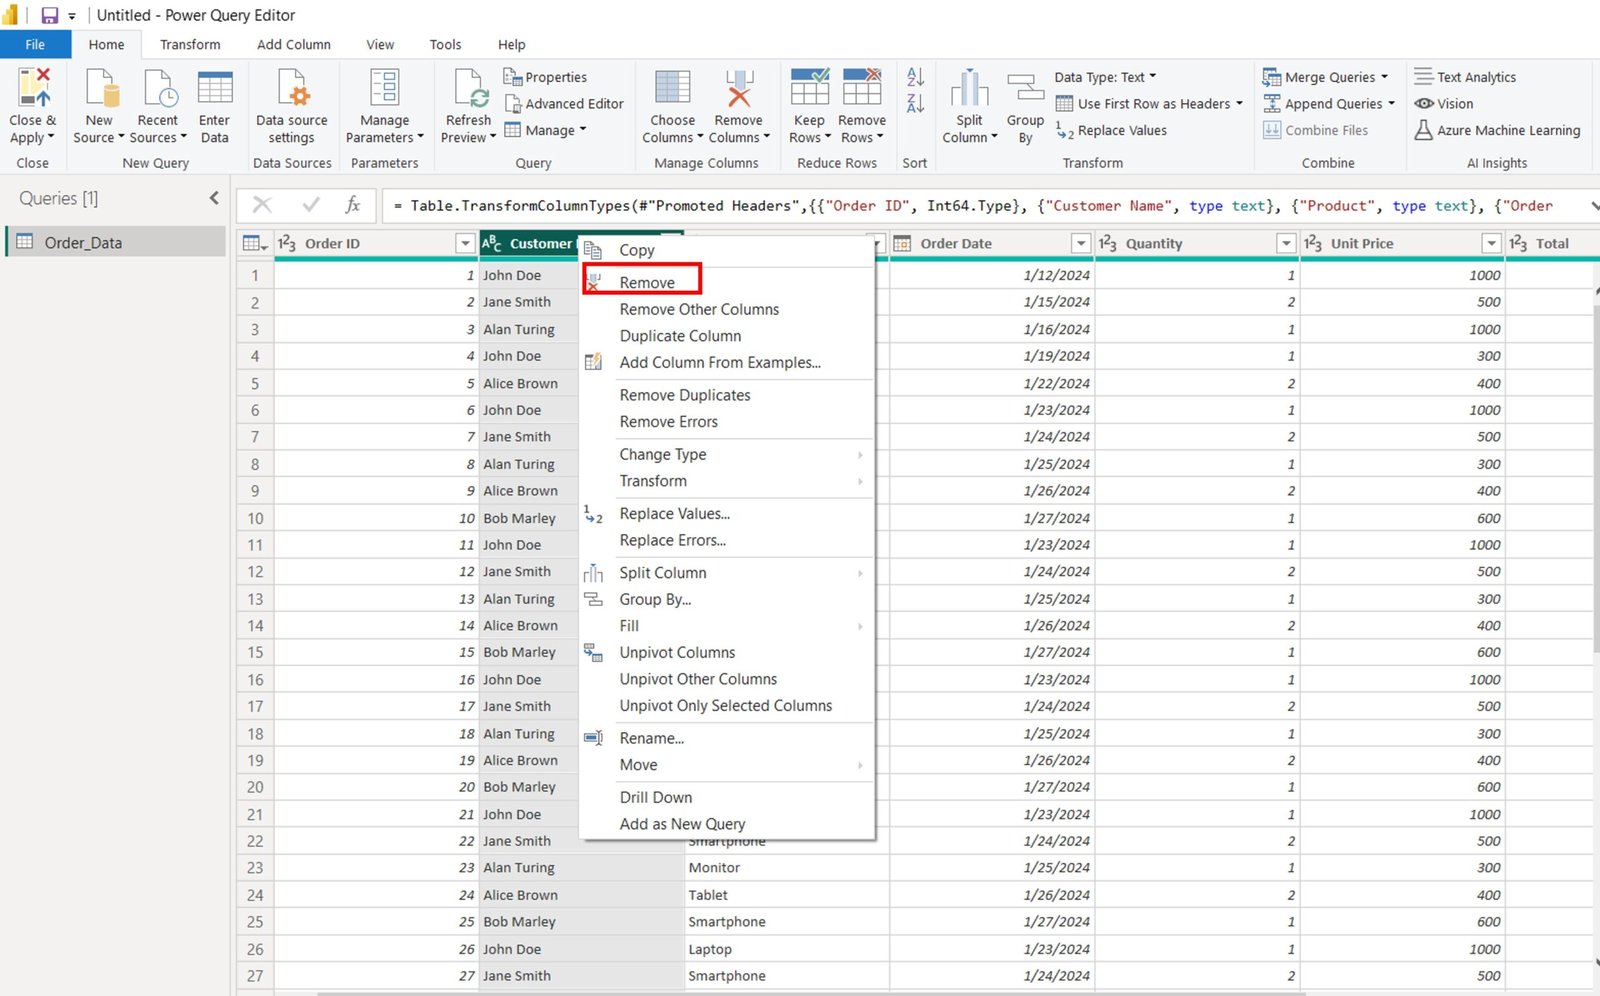
Removing a Single Column
If you only need to remove one column, Power Query provides an easy method to do so.
Steps to Remove a Single Column:
- Open Power Query Editor in Power BI.
- Click on the column header of the column you want to remove.
- Right-click on the column and select Remove from the context menu.
- Alternatively, you can click on the Remove Columns option from the Home tab in the Manage Columns group.
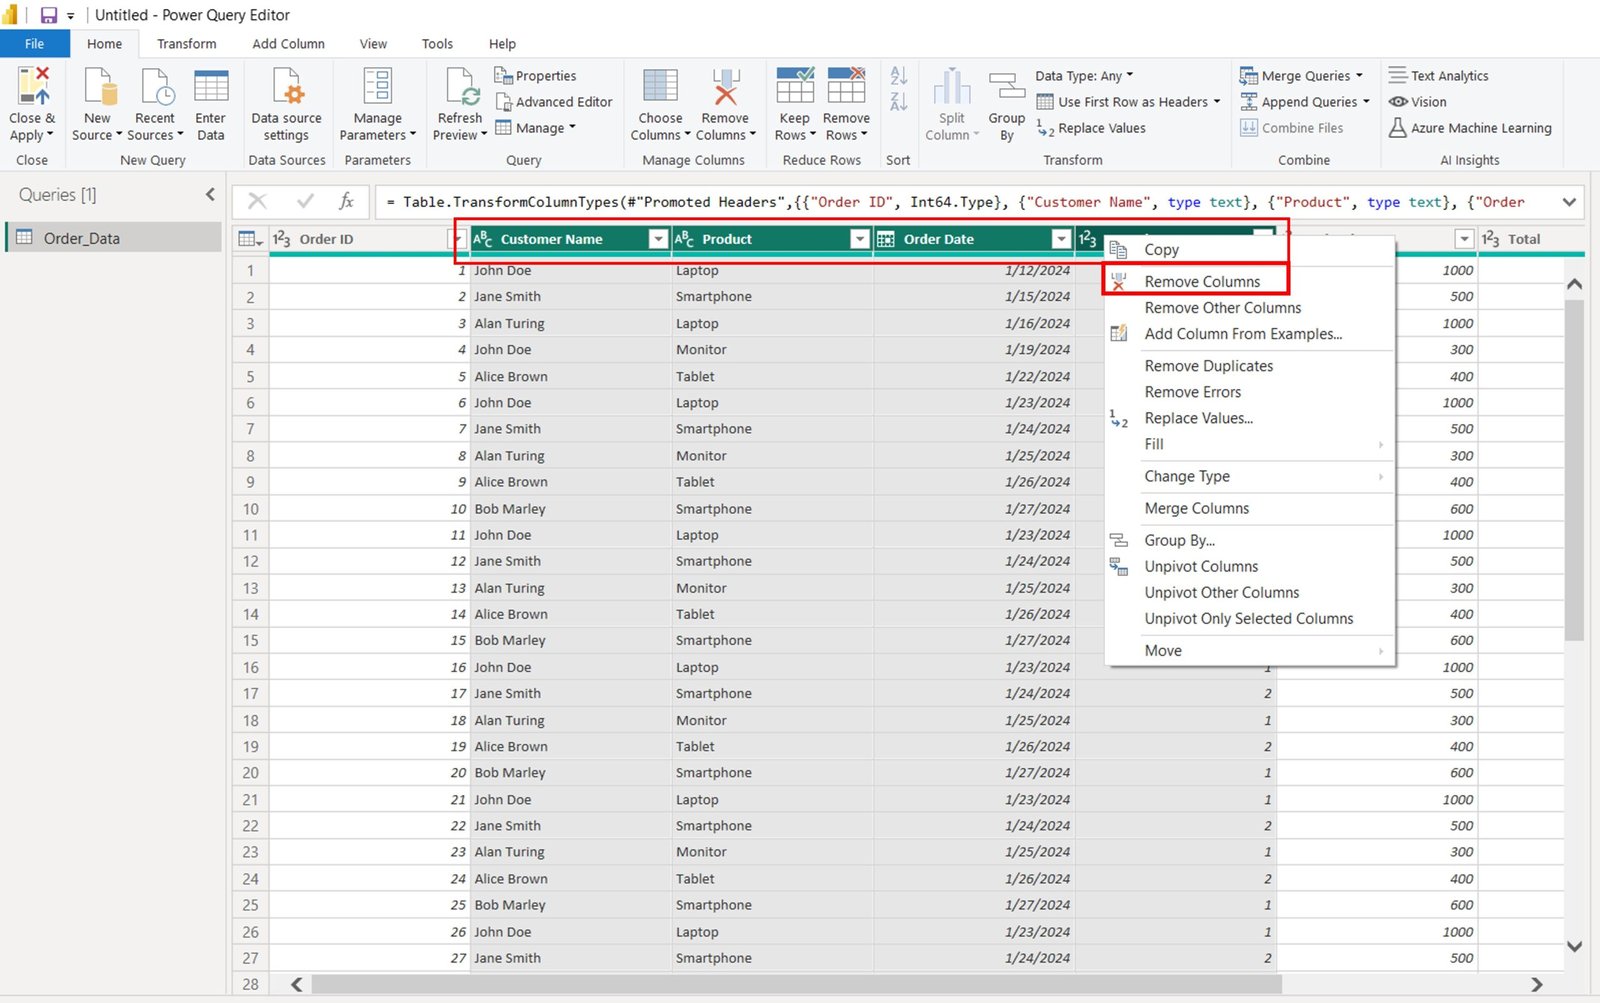
Removing Multiple Columns
Sometimes, you may need to remove more than one column at a time. Fortunately, Power Query lets you select and remove multiple columns in one go.
Steps to Remove Multiple Columns:
- Hold down Ctrl (Windows) or Cmd (Mac) while clicking the columns you want to remove.
- Right-click on any of the selected columns and choose Remove.
- Alternatively, select the Remove Columns option from the Home tab to remove all selected columns simultaneously.
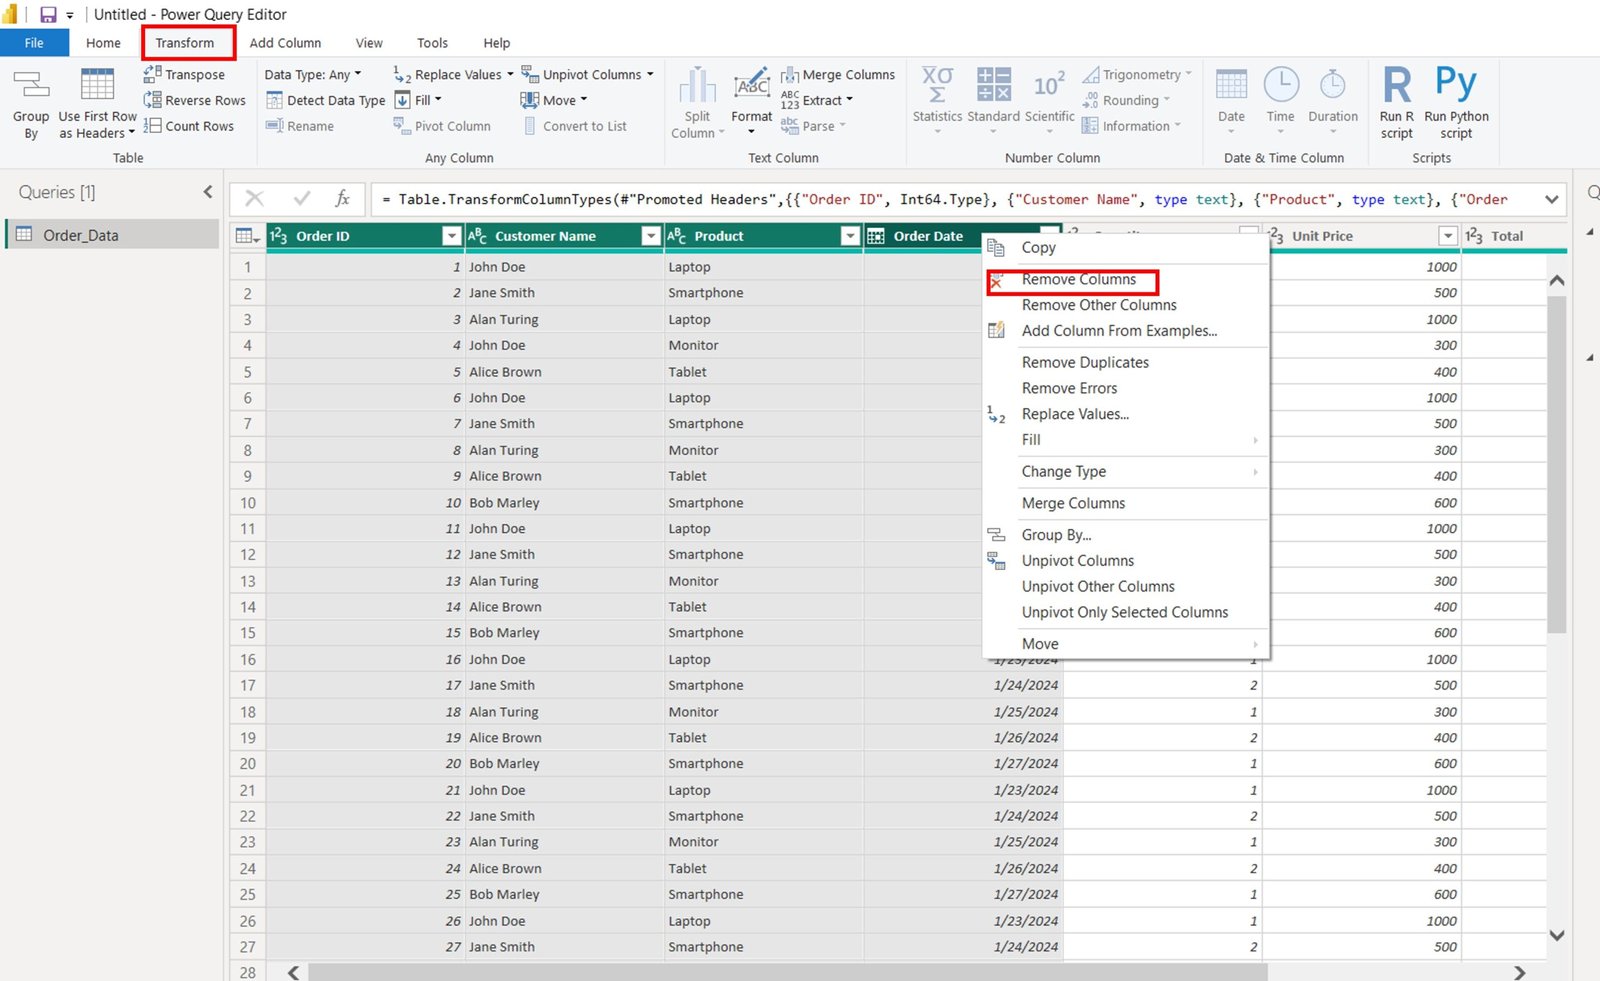
Removing Columns Using the Transform Tab
If you want another option, you can remove columns from the Transform tab in Power Query Editor.
Steps to Remove Columns Using the Transform Tab:
- Select the columns you wish to remove.
- Go to the Transform tab in Power Query Editor.
- In the Any Column group, click on Remove Columns.
- Click Remove to delete the selected columns from your dataset.
Removing Columns by Position
If you need to remove columns based on their position (e.g., the first or last column), Power Query makes this easy as well.
Steps to Remove Columns by Position:
- Click on the Home tab and select Remove Columns.
- Choose either Remove First Column or Remove Last Column, depending on your needs.
- Alternatively, select the columns manually and use the right-click menu to remove specific columns.
Practice Makes Perfect: Sample Dataset
To help you practice, here’s a sample dataset. Copy and paste this data into an Excel file, import it into Power BI, and try out the different methods of removing columns.

Final Thoughts
Removing unnecessary columns in Power Query is a key part of the data cleaning process. By following the steps outlined in this guide, you can easily eliminate columns that don’t contribute to your analysis. This will streamline your datasets, improve Power BI report performance, and make data modeling more efficient.
Take time to practice using the sample dataset and experiment with the various removal methods. With a little hands-on experience, you’ll become more comfortable using Power Query to create cleaner, more focused datasets that lead to better insights and analysis in Power BI.
Visit our YouTube channel to learn step-by-step video tutorials
Youtube.com/@NeotechNavigators

