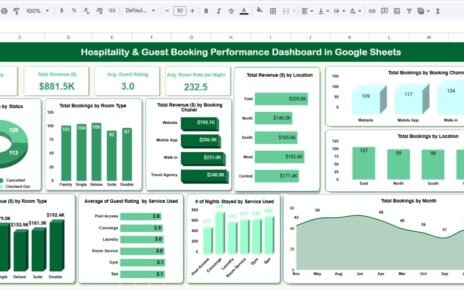
Research and Development (R&D) drives innovation, competitive advantage, and long-term business growth. Companies invest significant budgets into new products, process improvements, and technological innovation. However, managing R&D activities becomes challenging when teams rely on scattered spreadsheets, manual tracking, or disconnected reports.Research and Development Dashboard in Google Sheets
Without a structured monitoring system, organizations face:
- Budget overruns
- Delayed project timelines
- Poor resource allocation
- Limited visibility into innovation progress
- Difficulty measuring ROI from research investments
Therefore, businesses increasingly implement centralized analytics dashboards to monitor R&D performance effectively.
The Research and Development Dashboard in Google Sheets provides a powerful cloud-based solution that combines financial tracking, milestone monitoring, risk analysis, and innovation insights into one interactive platform.Research and Development Dashboard in Google Sheets
In this article, we will explain the structure, features, benefits, and best practices of this dashboard and how it helps organizations manage innovation strategically.
What Is a Research and Development Dashboard in Google Sheets?
Click to Buy Research and Development Dashboard in Google Sheets
A Research and Development Dashboard in Google Sheets is an interactive analytics system designed to track R&D KPIs such as budgets, milestones, risks, timelines, and innovation performance using automated charts and filters.
Instead of reviewing multiple project reports, decision-makers analyze performance through a single dashboard.
The dashboard enables organizations to:
- Monitor approved vs spent budgets
- Track milestone progress
- Analyze department performance
- Evaluate risks and quality issues
- Measure innovation output
- Forecast expected revenue from R&D initiatives
Because Google Sheets operates in the cloud, teams collaborate in real time from anywhere.
Why Is R&D Performance Tracking Important?
R&D projects involve uncertainty, high investment, and long timelines. Therefore, leaders must continuously track progress and financial efficiency.
Challenges Without an R&D Dashboard
- Lack of budget visibility
- Missed milestones
- Resource inefficiency
- Poor prioritization of projects
- Increased project risks
However, dashboards transform complex project data into actionable insights.
Key Benefits
- Improve strategic planning
- Control research spending
- Monitor innovation outcomes
- Enhance collaboration
- Reduce project delays
Overview of the Research and Development Dashboard
Click to Buy Research and Development Dashboard in Google Sheets
The dashboard consists of multiple analytical pages designed to evaluate innovation from different perspectives.
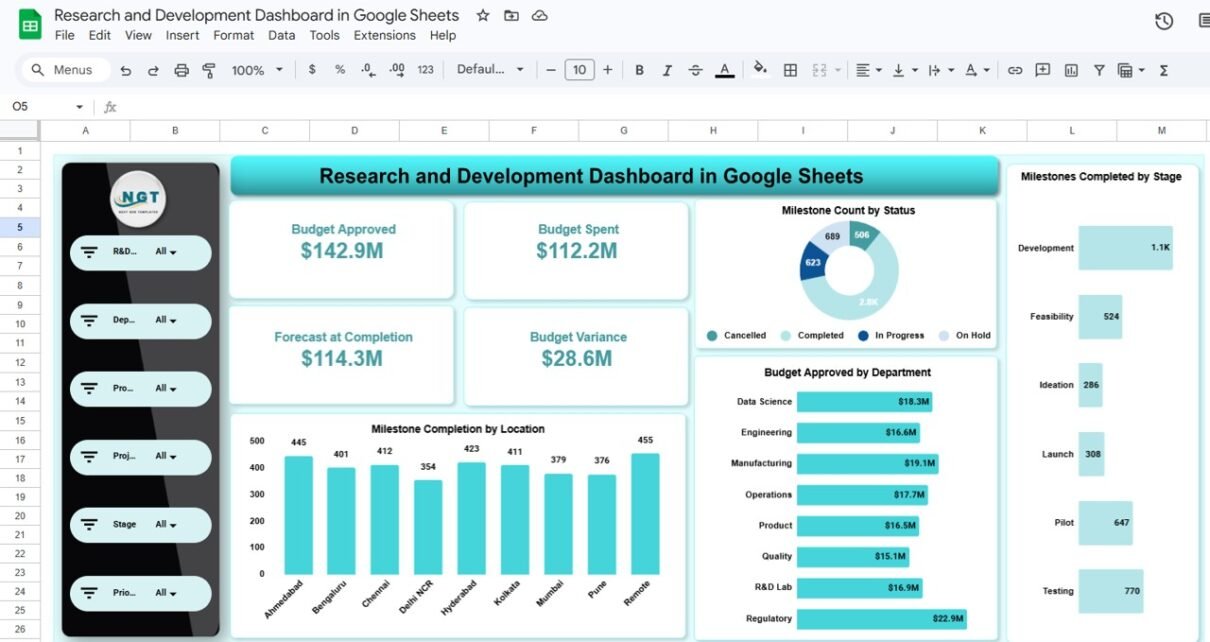
R&D Overview Dashboard
The Overview Page provides a high-level summary of research performance.
KPI Cards Displayed
- Budget Approved — $142.9M
- Budget Spent — $112.2M
- Forecast at Completion — $114.3M
- Budget Variance — $28.6M
These KPIs instantly show financial health.
Additional Visuals
- Milestone Count by Status
- Budget Approved by Department
- Milestone Completion by Location
- Milestones Completed by Stage
Managers quickly understand project progress and funding utilization.

Click to Buy Research and Development Dashboard in Google Sheets
Budget vs Financial Analysis
This page focuses on financial efficiency.
Key Charts
- Budget Spent by Priority Level
- Budget Variance by Product Line
- Budget Approved by Location
- Project Status Tracking
This analysis helps finance and leadership teams evaluate spending effectiveness.

Click to Buy Research and Development Dashboard in Google Sheets
Timeline & Delivery Analysis
The Timeline & Delivery Analysis page evaluates project execution.
Metrics Covered
- Average Schedule Variance by Sponsor
- Average Planned Hours by Department
- Actual Hours by Project Stage
- Expected Annual Revenue by Product Line
This helps managers identify schedule delays and resource gaps.

Click to Buy Research and Development Dashboard in Google Sheets
Risk & Quality Analysis
This page monitors project risks and quality performance.
Key Insights
- Average Risk Score by Risk Level
- Change Requests by Risk Level
- Defects Count by Department
- Quality Issues Distribution
Organizations reduce project failures by monitoring risks proactively.

Click to Buy Research and Development Dashboard in Google Sheets
Innovation Analysis Dashboard
The Innovation Analysis page measures innovation output.
Visual Metrics
- Expected Annual Revenue by R&D Category
- Experiment Count by Sponsor
- Prototype Count by Category
- Budget Spent by R&D Category
This enables leaders to measure innovation ROI effectively

Click to Buy Research and Development Dashboard in Google Sheets
Advantages of Research and Development Dashboard in Google Sheets
Centralized Innovation Monitoring
All R&D metrics appear in one platform.
Cloud Collaboration
Teams update and view data simultaneously.
Real-Time Insights
Charts update automatically.
Budget Control
Financial tracking prevents overspending.
Strategic Decision Support
Leadership identifies high-value projects quickly.
Easy Customization
Users modify metrics and visuals easily.
Cost-Effective Analytics
No expensive software required.
Best Practices for the Research and Development Dashboard in Google Sheets
Click to Buy Research and Development Dashboard in Google Sheets
- Maintain standardized project data formats
- Update budgets frequently
- Track milestone completion weekly
- Focus on innovation outcomes, not only spending
- Review risk metrics regularly
- Train teams on dashboard usage
- Validate data accuracy consistently
Conclusion
R&D success depends on visibility, financial discipline, and performance tracking. Without structured analytics, organizations struggle to manage innovation investments effectively.
The Research and Development Dashboard in Google Sheets simplifies complex R&D management by combining financial tracking, project monitoring, risk analysis, and innovation insights into one centralized solution.
By implementing this dashboard, organizations can:
- Improve innovation performance
- Control research budgets
- Reduce project risks
- Accelerate delivery timelines
- Make confident strategic decisions
Ultimately, this dashboard transforms research data into measurable business value.
Frequently Asked Questions (FAQs)
Click to Buy Research and Development Dashboard in Google Sheets
1. What is an R&D Dashboard?
It is a tool that tracks research projects, budgets, risks, and innovation performance in one place.
2. Can small teams use this dashboard?
Yes. It works for startups as well as large enterprises.
3. Does it require advanced technical skills?
No. Basic Google Sheets knowledge is sufficient.
4. Can KPIs be customized?
Yes. Users can modify metrics based on business needs.
5. Does the dashboard update automatically?
Yes. Charts refresh when data changes.
6. Is collaboration possible?
Yes. Multiple users can work simultaneously.
7. Which industries benefit most?
Technology, manufacturing, healthcare, and research organizations benefit greatly.
Visit our YouTube channel to learn step-by-step video tutorials
Youtube.com/@NeotechNavigators
Watch the step-by-step video tutorial:
Click to Buy Research and Development Dashboard in Google Sheets