Effective resource management is critical for project success. The Resource Allocation Dashboard in Google Sheets helps managers track resource utilization, allocation, and productivity efficiently. This ready-to-use dashboard provides real-time insights to optimize workforce allocation across departments, projects, and roles.Resource Allocation Dashboard in Google Sheets
In this article, we will explain the key features, benefits, and best practices of using this dashboard.Resource Allocation Dashboard in Google Sheets
What Is a Resource Allocation Dashboard in Google Sheets?
A Resource Allocation Dashboard is a visual tool that monitors how employees or resources are allocated across projects, departments, and tasks. It enables managers to balance workloads, track utilization, and improve operational efficiency.
With Google Sheets, this dashboard is easy to use, collaborative, and dynamic, allowing managers to monitor resource performance in real time.
Key Features of the Resource Allocation Dashboard
Click to Buy Resource Allocation Dashboard in Google Sheets
This dashboard contains three main sheets, designed to streamline resource management:
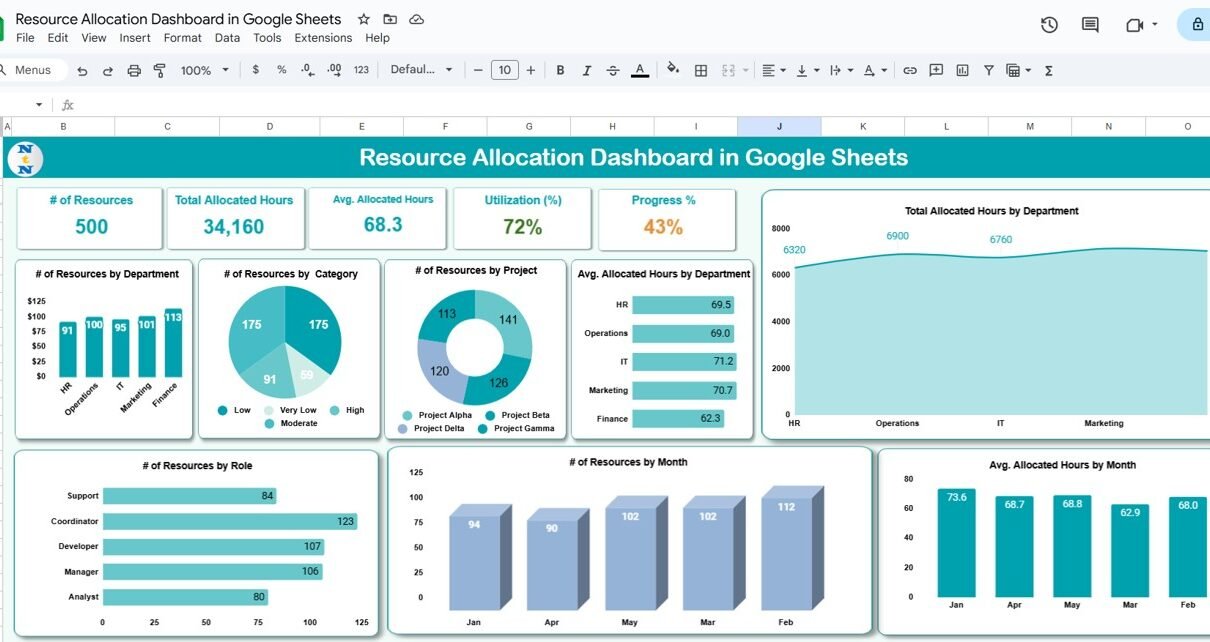
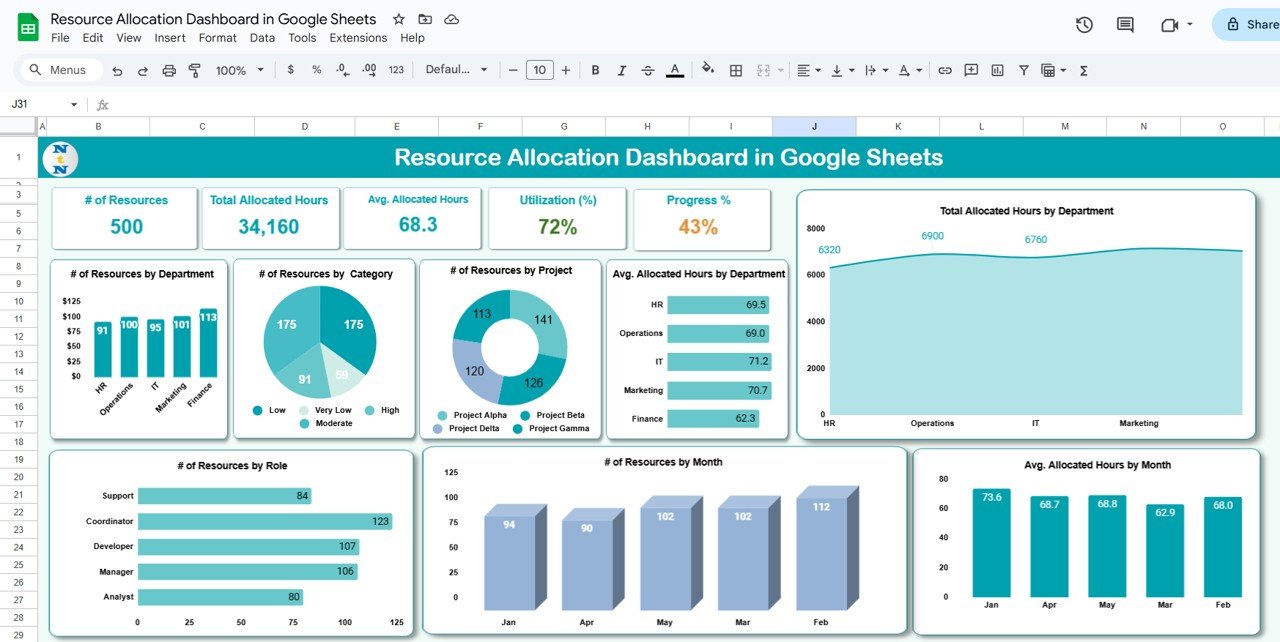
1. Dashboard Sheet Tab
The Dashboard Sheet provides a high-level overview of all resources and allocation metrics.
Cards:
-
# of Resources: Total number of employees or team members
-
Total Allocated Hours: Combined hours allocated across projects
-
Avg. Allocated Hours: Average hours per resource
-
Utilization (%): Percentage of resource usage against capacity
-
Progress %: Overall progress of allocated tasks or projects
Charts:
-
# of Resources by Department: Visualizes team distribution across departments
-
# of Resources by Category: Tracks allocation based on resource type or skill category
-
# of Resources by Project: Shows which projects are consuming the most resources
-
Avg. Allocated Hours by Department: Highlights workload balance across departments
-
Total Allocated Hours by Department: Identifies resource-heavy departments
-
Avg. Allocated Hours by Month: Tracks trends in resource utilization over time
-
# of Resources by Month: Shows monthly distribution of resources
-
# of Resources by Role: Displays role-wise allocation
Click to Buy Resource Allocation Dashboard in Google Sheets
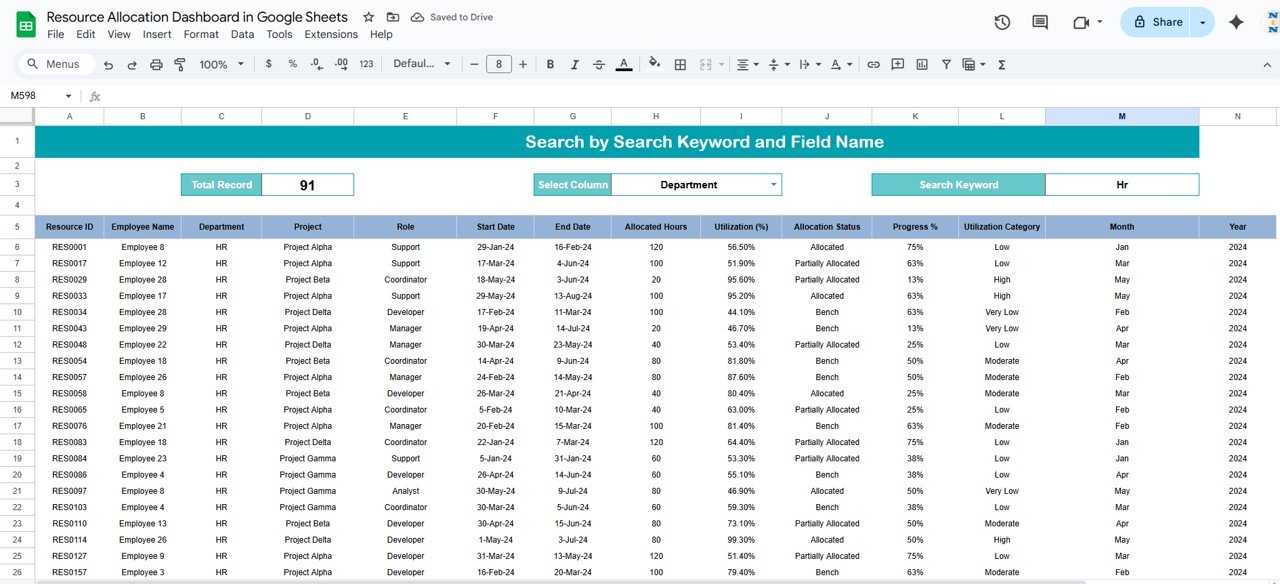
2. Search Sheet Tab
The Search Sheet allows users to quickly find information by keyword or field name.
-
Example: Search by resource name, project, department, or role
-
Helps managers locate specific resource allocation records without scrolling through large datasets
Click to Buy Resource Allocation Dashboard in Google Sheets
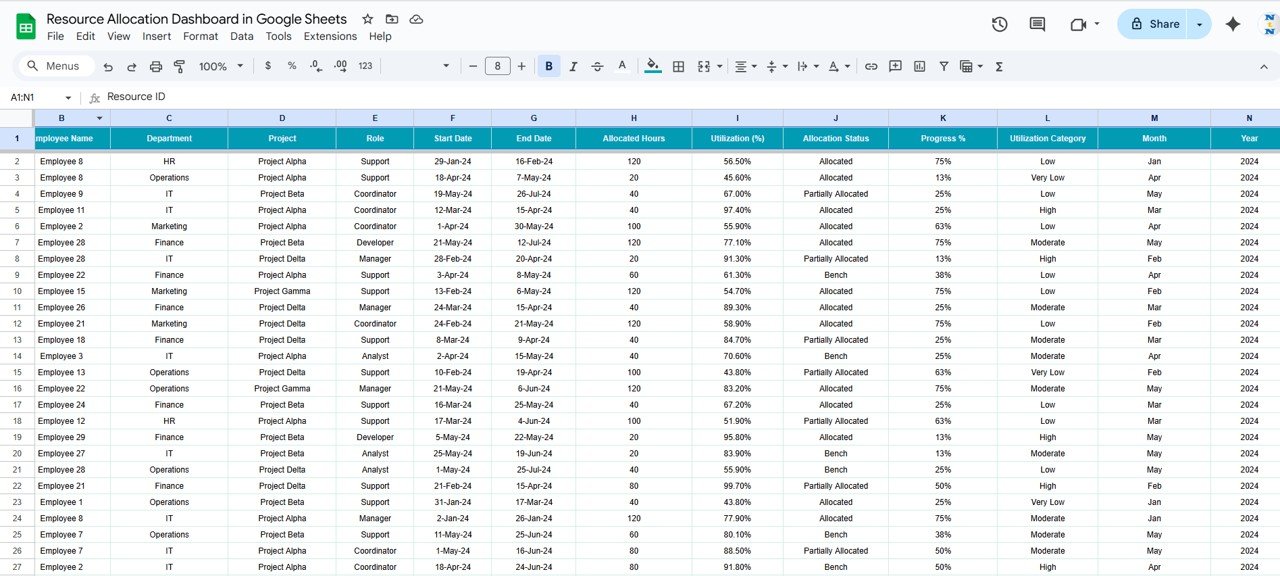
3. Data Sheet Tab
The Data Sheet is the input sheet where all resource allocation data is recorded:
-
Each record includes resource name, department, project, role, allocated hours, and other relevant details
-
Updating this sheet automatically reflects changes on the Dashboard and Search sheets
-
Ensures accurate tracking and reporting of resource utilization
Advantages of Using the Resource Allocation Dashboard
Click to Buy Resource Allocation Dashboard in Google Sheets
-
Centralized Resource Data: All information is tracked in one Google Sheet
-
Real-Time Insights: Cards and charts provide instant visualization of allocation metrics
-
Optimize Utilization: Identify underutilized or over-allocated resources
-
Departmental Analysis: Monitor resource distribution across departments and projects
-
Role-Based Tracking: Analyze resource allocation by skill or role
-
Time-Saving: Automates calculations, visualizations, and reports for faster decision-making
Best Practices for Using the Dashboard
-
Update Data Regularly: Enter allocation hours and project assignments promptly
-
Track Utilization Percentages: Monitor workloads to prevent over-allocation
-
Segment by Department and Role: Use filters for detailed insights
-
Analyze Monthly Trends: Check charts for patterns in resource usage over time
-
Plan Resource Allocation Strategically: Balance workload across teams and projects
-
Review Progress Metrics: Use the Progress % card to identify stalled projects or tasks
How This Dashboard Helps Managers
Click to Buy Resource Allocation Dashboard in Google Sheets
-
Monitor Resource Efficiency: Identify over- or under-utilized resources
-
Plan Project Assignments: Allocate team members based on availability and skill
-
Support Decision-Making: Use real-time metrics for data-driven allocation
-
Improve Productivity: Optimize workloads to enhance project outcomes
-
Forecast Resource Needs: Analyze trends to plan future staffing requirements
Frequently Asked Questions (FAQs)
Click to Buy Resource Allocation Dashboard in Google Sheets
Q1: Can I customize the dashboard for different teams?
Yes, you can add departments, roles, or projects to match your organization’s structure.
Q2: How often should I update the data?
Update allocation data as projects progress, ideally weekly or monthly, to maintain accurate dashboards.
Q3: Can this dashboard track multiple projects simultaneously?
Yes, the dashboard supports multi-project tracking using the # of Resources by Project chart.
Q4: Can I monitor utilization by role?
Yes, the dashboard provides charts for # of Resources by Role and Avg. Allocated Hours by Role.
Q5: Does the dashboard help prevent over-allocation?
Yes, by monitoring Utilization (%) and Avg. Allocated Hours, managers can balance workloads effectively.
Conclusion
The Resource Allocation Dashboard in Google Sheets is a powerful tool for managing workforce efficiency. With visual metrics, role-based analysis, and departmental tracking, this dashboard ensures optimal resource utilization, enhances productivity, and supports strategic decision-making.
Visit our YouTube channel to learn step-by-step video tutorials
Youtube.com/@NeotechNavigators