Resource allocation plays a critical role in project success, operational efficiency, and cost control. Teams, budgets, and time are limited resources. Therefore, organizations must allocate them wisely to avoid overutilization, idle capacity, and missed deadlines. However, when resource data sits in scattered spreadsheets or manual reports, decision-making becomes slow and inaccurate.Resource Allocation KPI Dashboard in Google Sheets
That is exactly why a Resource Allocation KPI Dashboard in Google Sheets becomes an essential management tool.
This ready-to-use dashboard helps organizations track how effectively they allocate resources across projects, departments, and time periods. It provides clear MTD and YTD KPIs, target comparisons, previous year analysis, and visual performance indicators that support faster and better decisions.Resource Allocation KPI Dashboard in Google Sheets
In this article, you will learn what this dashboard is, how it works, its KPIs, advantages, improvement opportunities, best practices, and frequently asked questions.Resource Allocation KPI Dashboard in Google Sheets
What Is a Resource Allocation KPI Dashboard in Google Sheets?
Click to Buy Resource Allocation KPI Dashboard in Google Sheets
A Resource Allocation KPI Dashboard in Google Sheets is an interactive performance tracking tool that measures how efficiently an organization assigns and uses its resources.
Instead of manually calculating utilization and capacity, this dashboard:
- Centralizes all resource KPIs
- Tracks MTD and YTD performance
- Compares Actual vs Target values
- Shows Previous Year comparisons
- Highlights performance using up/down arrows
Because it runs in Google Sheets, teams can collaborate in real time and update data without complex tools.
Why Is Resource Allocation Tracking Important?
Poor resource allocation leads to burnout, idle resources, higher costs, and delayed projects. Therefore, tracking allocation KPIs helps organizations:
- Balance workloads effectively
- Improve productivity and utilization
- Reduce overtime and idle time
- Control project costs
- Improve planning accuracy
As a result, organizations achieve better operational efficiency and employee satisfaction.
Key Features of the Resource Allocation KPI Dashboard
This dashboard follows a structured and scalable design suitable for all industries.
Key Highlights
- Month selector for instant analysis
- MTD and YTD KPI tracking
- Target vs Actual comparison
- Previous Year performance comparison
- Conditional formatting with arrows
- Dedicated KPI trend analysis
- Separate data entry and definition sheets
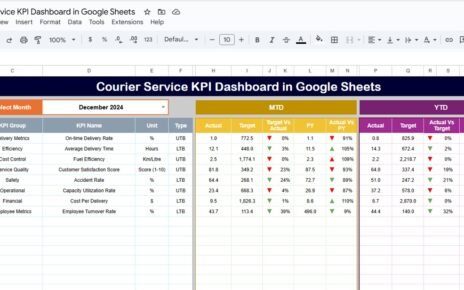
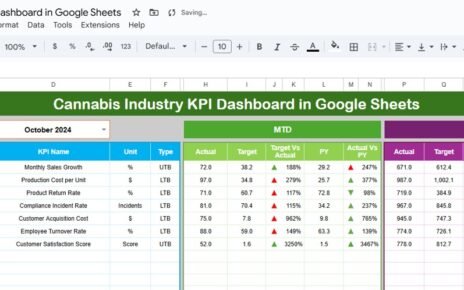
Dashboard Sheet Tab – Main KPI View
Click to Buy Resource Allocation KPI Dashboard in Google Sheets
The Dashboard Sheet provides a high-level view of resource allocation performance.
Month Selection
-
Select the month from Cell D3
-
All KPIs update automatically for that month
MTD KPIs Displayed
For each KPI, the dashboard shows:
- MTD Actual
- MTD Target
- MTD Previous Year
- Target vs Actual (%)
- PY vs Actual (%)
Conditional arrows quickly indicate improvement or decline.
YTD KPIs Displayed
The dashboard also tracks:
- YTD Actual
- YTD Target
- YTD Previous Year
- Target vs Actual (%)
- PY vs Actual (%)
This view supports long-term resource planning.

Click to Buy Resource Allocation KPI Dashboard in Google Sheets
KPI Trend Sheet Tab – KPI Deep Dive
The KPI Trend Sheet provides detailed KPI understanding.
How It Works
- Select a KPI name from the dropdown in Cell C3
- The sheet dynamically displays KPI details
Displayed Information
- KPI Group
- KPI Unit
- KPI Type (Lower the Better / Upper the Better)
- KPI Formula
- KPI Definition
This ensures transparency and clarity for all stakeholders.

Click to Buy Resource Allocation KPI Dashboard in Google Sheets
Actual Number Sheet Tab
This sheet stores actual performance data.
How to Use
-
Enter the first month of the year in Cell E1
-
Input MTD Actual and YTD Actual values
-
The dashboard updates automatically

Target Sheet Tab
The Target Sheet defines expected performance levels.
Data Entry
-
Enter MTD Target values for each KPI
-
Enter YTD Target values for cumulative tracking
Targets allow objective performance evaluation.

Click to Buy Resource Allocation KPI Dashboard in Google Sheets
Previous Year Number Sheet Tab
This sheet enables year-over-year comparison.
Purpose
-
Enter previous year MTD and YTD values
-
Identify recurring allocation issues
-
Measure improvement trends

Click to Buy Resource Allocation KPI Dashboard in Google Sheets
KPI Definition Sheet Tab – KPI Master
This sheet acts as the KPI reference library.
Fields Included
- KPI Name
- KPI Group
- Unit
- Formula
- Definition
- KPI Type

Advantages of Using the Resource Allocation KPI Dashboard
-
Centralized resource performance tracking
-
Improved workload balance
-
Better project planning
-
Reduced burnout and idle time
-
Faster decision-making
-
Easy collaboration in Google Sheets
-
No expensive BI tools required
Opportunities for Improvement
Click to Buy Resource Allocation KPI Dashboard in Google Sheets
Organizations can enhance this dashboard by:
-
Adding project-wise allocation analysis
-
Integrating skills-based resource matching
-
Automating data input via Google Forms
-
Adding forecast vs actual allocation
-
Linking resource KPIs with project outcomes
Best Practices for Using the Resource Allocation Dashboard
-
Update allocation data regularly
-
Review utilization weekly or monthly
-
Compare Actual vs Target consistently
-
Address over- and underutilization quickly
-
Share insights with project and HR teams
-
Use trends to improve planning accuracy
Conclusion
Click to Buy Resource Allocation KPI Dashboard in Google Sheets
A Resource Allocation KPI Dashboard in Google Sheets provides a clear and structured way to monitor how effectively an organization uses its resources. It replaces guesswork with actionable insights and supports smarter planning, balanced workloads, and improved productivity.
Because the dashboard is flexible, collaborative, and scalable, it becomes a long-term solution for operational excellence.
Frequently Asked Questions (FAQs)
1. Who should use this dashboard?
Project managers, PMOs, HR teams, and operations leaders.
2. Can KPIs be customized?
Yes, all KPIs, formulas, and targets are fully customizable.
3. Does the dashboard support MTD and YTD tracking?
Yes, it supports both with historical comparisons.
4. Is Google Sheets secure for resource data?
Yes, with proper access permissions and sharing controls.
5. Can this dashboard scale for large organizations?
Yes, it works for small teams and enterprise environments.
Visit our YouTube channel to learn step-by-step video tutorials
Youtube.com/@NeotechNavigators
Watch the step-by-step video tutorial:
Click to Buy Resource Allocation KPI Dashboard in Google Sheets