In today’s competitive retail environment, tracking key performance indicators (KPIs) is essential to understand business performance, customer satisfaction, and sales trends. The Retail KPI Scorecard in Google Sheets is a ready-to-use, interactive template that helps retail businesses monitor performance metrics with ease.
In this article, we’ll explore the key features, benefits, and best practices of using this KPI scorecard to enhance your retail operations.
What Is a Retail KPI Scorecard?
A Retail KPI Scorecard is a visual dashboard that tracks important metrics related to sales, customer experience, and operational efficiency. It provides a clear, data-driven overview of how your retail business is performing on a monthly and yearly basis.
With this Google Sheets Scorecard, you can:
-
Monitor KPIs such as sales growth, conversion rate, and footfall trends
-
Compare Month-to-Date (MTD) and Year-to-Date (YTD) performance
-
Analyze targets vs. actuals using color-coded indicators and arrows
-
Gain real-time insights into key business drivers
Key Features of the Retail KPI Scorecard in Google Sheets
This ready-to-use scorecard is designed with simplicity and functionality in mind.
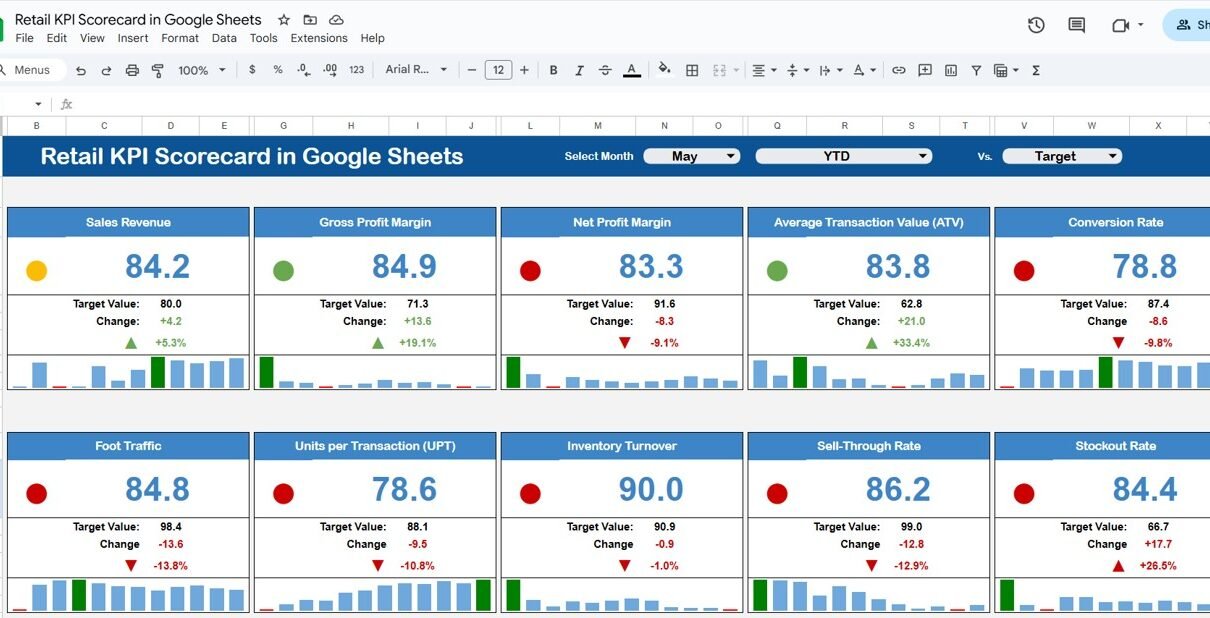
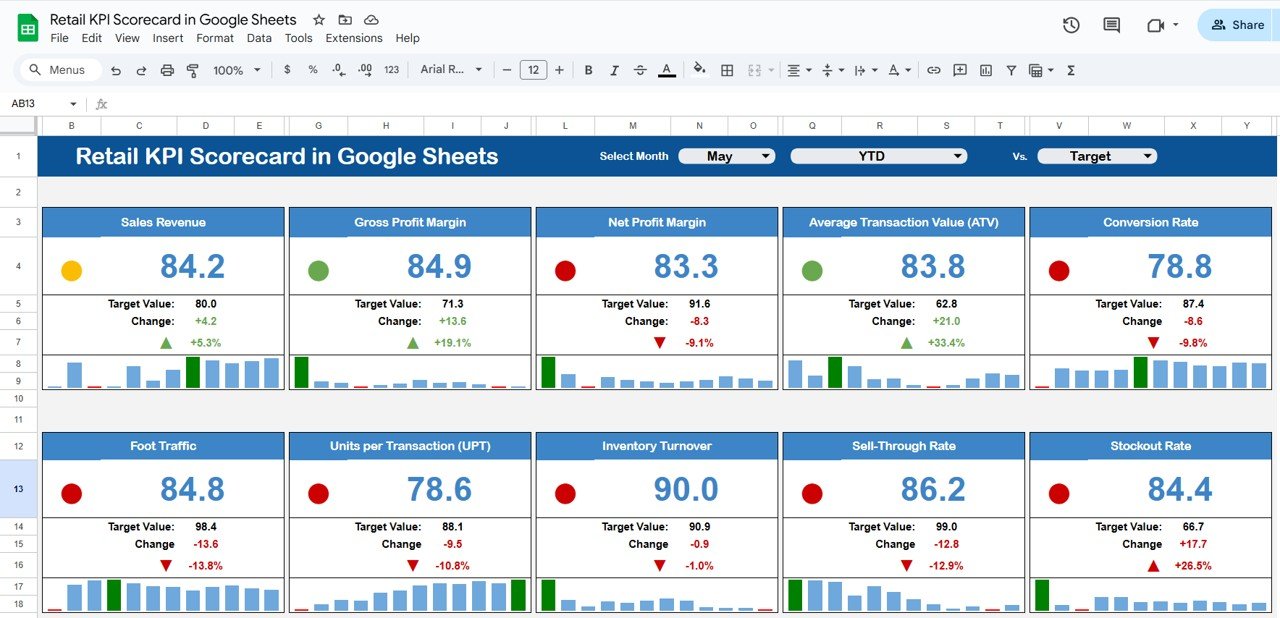
1. Dashboard Sheet Tab
The Dashboard Sheet is the main interface that displays all KPI metrics.
-
Interactive Month Dropdown (Cell D3): Select any month to view updated data automatically.
-
Dynamic Indicators: Traffic light icons and up/down arrows show performance trends visually.
-
Performance Comparison: Instantly compare MTD and YTD values to targets and previous years.
This feature makes it easy for managers to track performance without digging into multiple reports.
Click to Buy Retail KPI Scorecard in Google Sheets
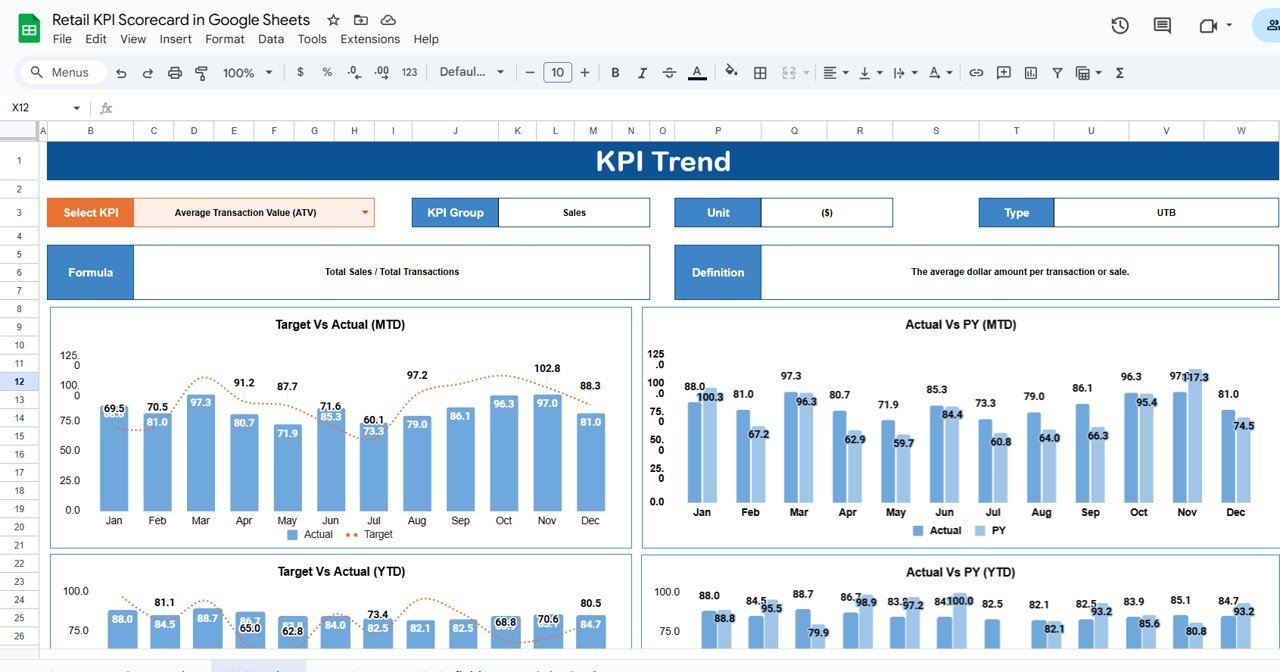
2. Trend Sheet Tab
The Trend Sheet allows detailed analysis of KPI performance over time.
-
Select a KPI name from the dropdown in Cell C3.
-
Displays KPI Group, Unit, Formula, Type (UTB – Upper The Better / LTB – Lower The Better).
-
Provides a visual trend chart to analyze progress over months.
This helps managers identify which KPIs are improving and which need attention.
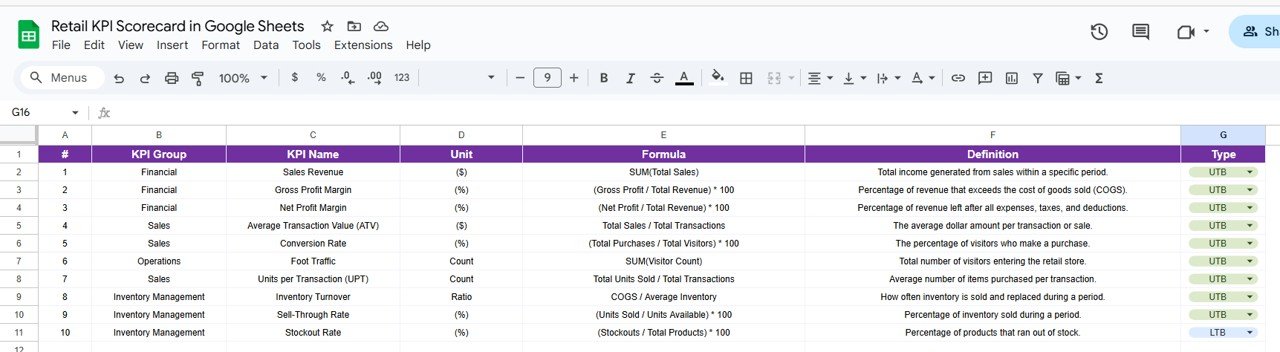
3. KPI Definition Sheet Tab
The KPI Definition Sheet ensures clarity and consistency by defining each metric.
-
Includes KPI Name, Group, Unit, Formula, Definition, and Type (UTB/LTB).
-
Ensures all team members understand how each KPI is measured.
-
Eliminates confusion and improves reporting accuracy.’
Click to Buy Retail KPI Scorecard in Google Sheets
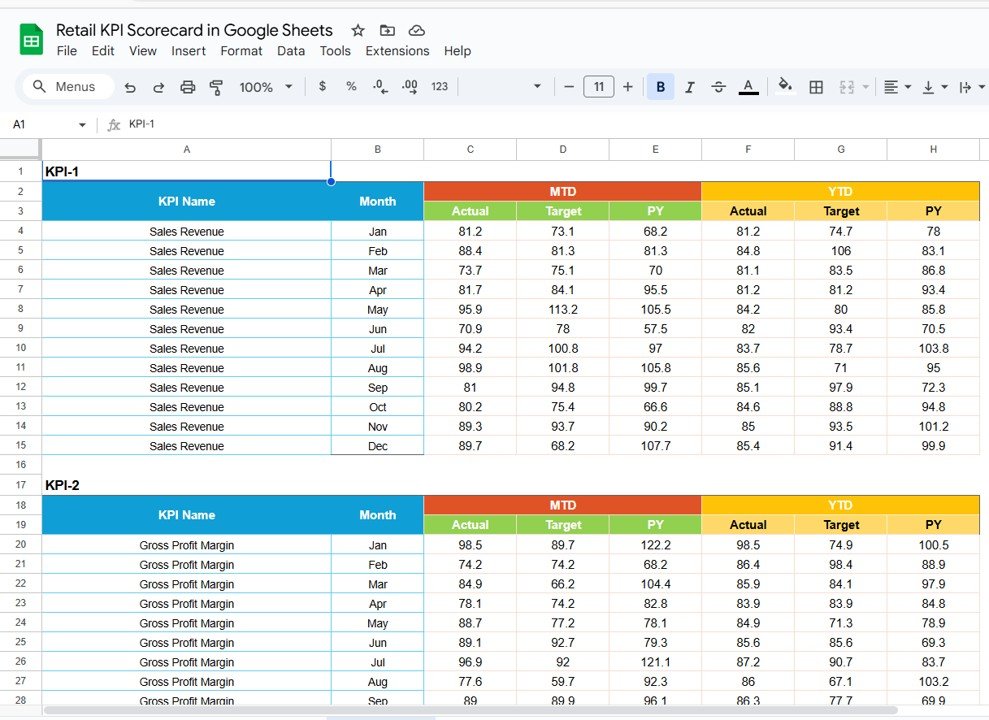
4. Data Input Sheet Tab
The Data Input Sheet is where all the actual KPI values are recorded.
-
Input monthly actuals and targets in a structured table.
-
Automatically feeds into the dashboard for visualization.
-
Helps maintain historical data for performance comparison.
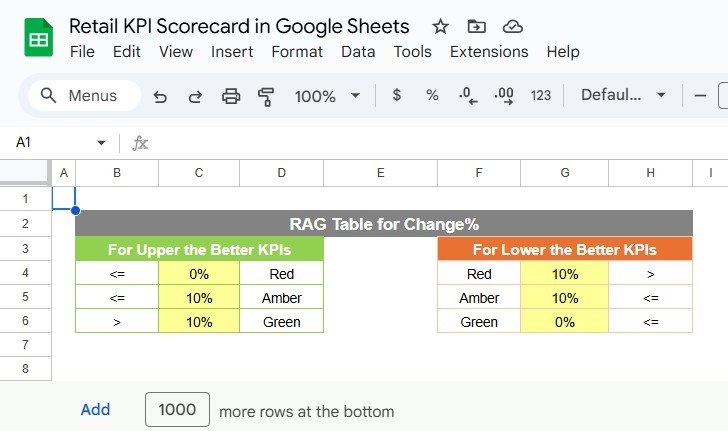
5. Color Settings Tab
The Color Settings Tab allows customization of performance indicators.
-
Adjust color codes for thresholds such as “Excellent,” “Average,” and “Below Target.”
-
Modify icons and conditional formatting as per your brand or preferences.
-
Makes the scorecard visually appealing and easy to interpret.
Click to Buy Retail KPI Scorecard in Google Sheets
Advantages of Using the Retail KPI Scorecard
-
Real-Time Insights: Monitor store performance instantly using dynamic charts.
-
Performance Visualization: Use arrows and colors to identify trends at a glance.
-
Improved Decision-Making: Focus on KPIs that impact profitability and efficiency.
-
Monthly and Yearly Comparison: Track growth and changes over time.
-
Customizable: Add or modify KPIs based on your store’s priorities.
-
Collaboration Ready: Since it’s built in Google Sheets, teams can view and update it together.
Best Practices for Using the Retail KPI Scorecard
-
Update Data Monthly: Keep KPI data current for accurate insights.
-
Set Realistic Targets: Ensure goals are measurable and achievable.
-
Use Visual Cues Effectively: Green for success, red for issues—simple and intuitive.
-
Focus on Key Metrics: Don’t overload the scorecard; track the KPIs that truly matter.
-
Review Trends Regularly: Analyze KPI trends quarterly to identify improvement areas.
-
Share Reports: Share dashboard links with stakeholders for transparency and accountability.
How This Scorecard Helps Retail Managers
Click to Buy Retail KPI Scorecard in Google Sheets
-
Sales Monitoring: Track overall revenue and identify high-performing periods.
-
Customer Insights: Analyze satisfaction and conversion rates for better experience.
-
Operational Efficiency: Understand stock turnover and reduce waste.
-
Employee Productivity: Assess performance and incentivize high achievers.
-
Profitability Analysis: Compare profit margins across time and regions.
Frequently Asked Questions (FAQs)
Click to Buy Retail KPI Scorecard in Google Sheets
Q1: Can I customize the KPIs in this scorecard?
Yes, you can add, edit, or remove KPIs based on your retail business needs.
Q2: Does it work for multiple store locations?
Yes, you can expand the data input to include branches or regions.
Q3: Can I track both MTD and YTD data?
Absolutely. The scorecard provides both Month-to-Date and Year-to-Date views.
Q4: Do I need advanced Excel or Sheets skills to use this template?
No, the template is designed to be simple and user-friendly with dropdowns and formulas pre-set.
Q5: Can I visualize trends for individual KPIs?
Yes, the Trend Sheet allows you to select any KPI and view its performance over time.
Conclusion
The Retail KPI Scorecard in Google Sheets is a powerful, ready-to-use tool for retail managers who want to measure and improve store performance. With interactive visuals, dynamic data updates, and clear KPI definitions, it helps businesses stay competitive, efficient, and customer-focused.
Visit our YouTube channel to learn step-by-step video tutorials
Youtube.com/@NeotechNavigators
Watch the step-by-step video Demo: