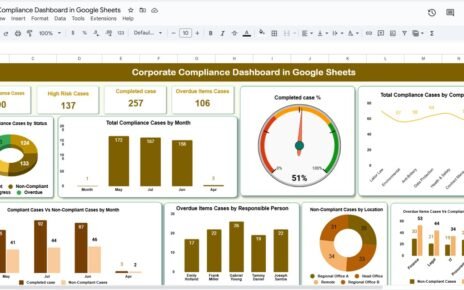
Managing your sales pipeline effectively is crucial for business growth. A Sales Funnel Dashboard in Google Sheets provides a ready-to-use solution for tracking leads, opportunities, conversions, and sales performance. This dashboard consolidates data across multiple dimensions and gives actionable insights for sales teams and managers.Sales Funnel Dashboard in Google Sheets
In this article, we will explain the features, benefits, and best practices of using this Sales Funnel Dashboard.Sales Funnel Dashboard in Google Sheets
What Is a Sales Sales Funnel Dashboard in Google Sheets?
A Sales Funnel Dashboard visualizes the journey of leads through your sales pipeline, from initial contact to closed deals. It helps businesses:
-
Track total leads and opportunity values
-
Monitor sales conversions and lost opportunities
-
Evaluate sales representative performance
-
Analyze trends by stage, source, and region
With Google Sheets, this dashboard is collaborative, flexible, and easy to update, making it ideal for teams of all sizes.
Key Features of the Sales Funnel Dashboard
Click to Buy Sales Funnel Dashboard in Google Sheets
This dashboard contains six sheet tabs, each designed for a specific purpose:
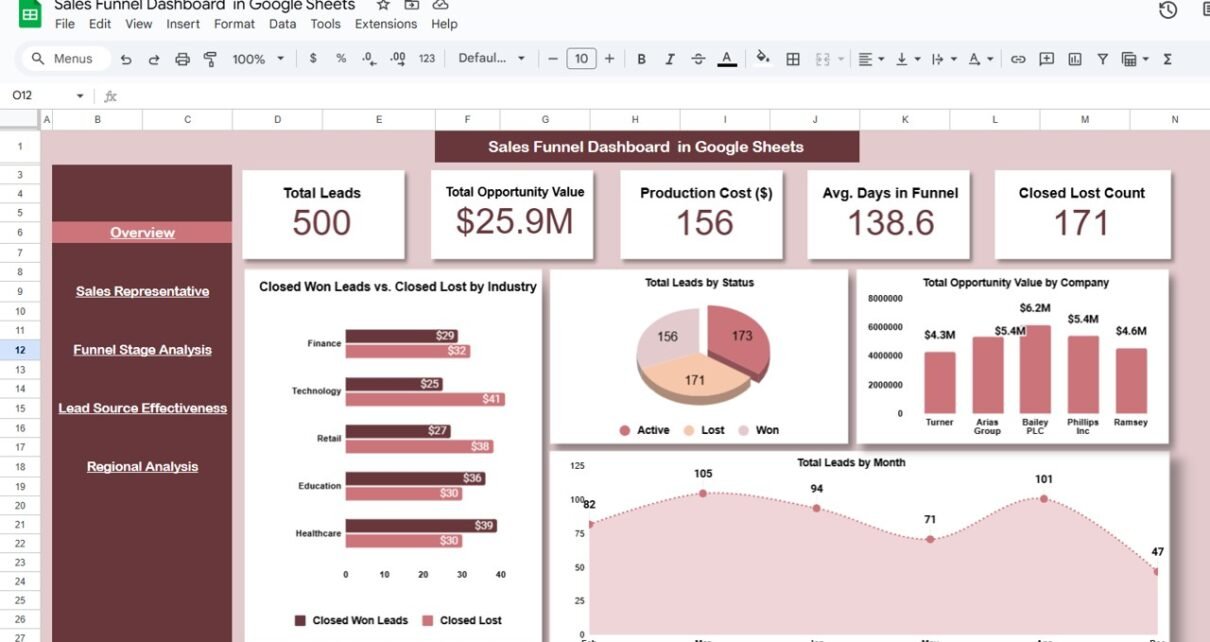
1. Overview Sheet Tab
The Overview Sheet provides a high-level snapshot of your sales funnel.
Cards:
-
Total Leads – Number of leads in the pipeline
-
Total Opportunity Value – Combined value of all opportunities
-
Closed Won Count – Total successfully closed deals
-
Closed Lost Count – Total lost opportunities
-
Avg. Days in Funnel – Average duration of leads in the sales process
Charts:
-
Closed Won vs. Closed Lost by Industry
-
Total Leads by Status
-
Total Opportunity Value by Company
-
Total Leads by Month
This page helps track overall performance and identify key trends.

Click to Buy Sales Funnel Dashboard in Google Sheets
2. Sales Representative Sheet Tab
This sheet analyzes sales rep performance.
Charts:
-
Total Leads by Sales Representative
-
Total Opportunity Value by Sales Representative
-
Closed Won vs. Closed Lost by Sales Representative
-
Average Days in Funnel by Sales Representative
This allows managers to monitor performance, assign coaching, and optimize team efficiency.

3. Funnel Stage Analysis Sheet Tab
Track performance by each stage of your sales pipeline.
Charts:
-
Total Leads by Stage
-
Total Opportunity Value by Stage
-
Closed Won vs. Closed Lost by Stage
-
Average Days in Funnel by Stage
This sheet helps identify bottlenecks and optimize lead movement through the funnel.

Click to Buy Sales Funnel Dashboard in Google Sheets
4. Lead Source Effectiveness Sheet Tab
Analyze how different lead sources perform in your pipeline.
Charts:
-
Total Leads by Lead Source
-
Average Days in Funnel by Lead Source
-
Total Opportunity Value by Lead Source
-
Closed Won vs. Closed Lost by Lead Source
This data helps sales and marketing teams focus on high-performing channels.

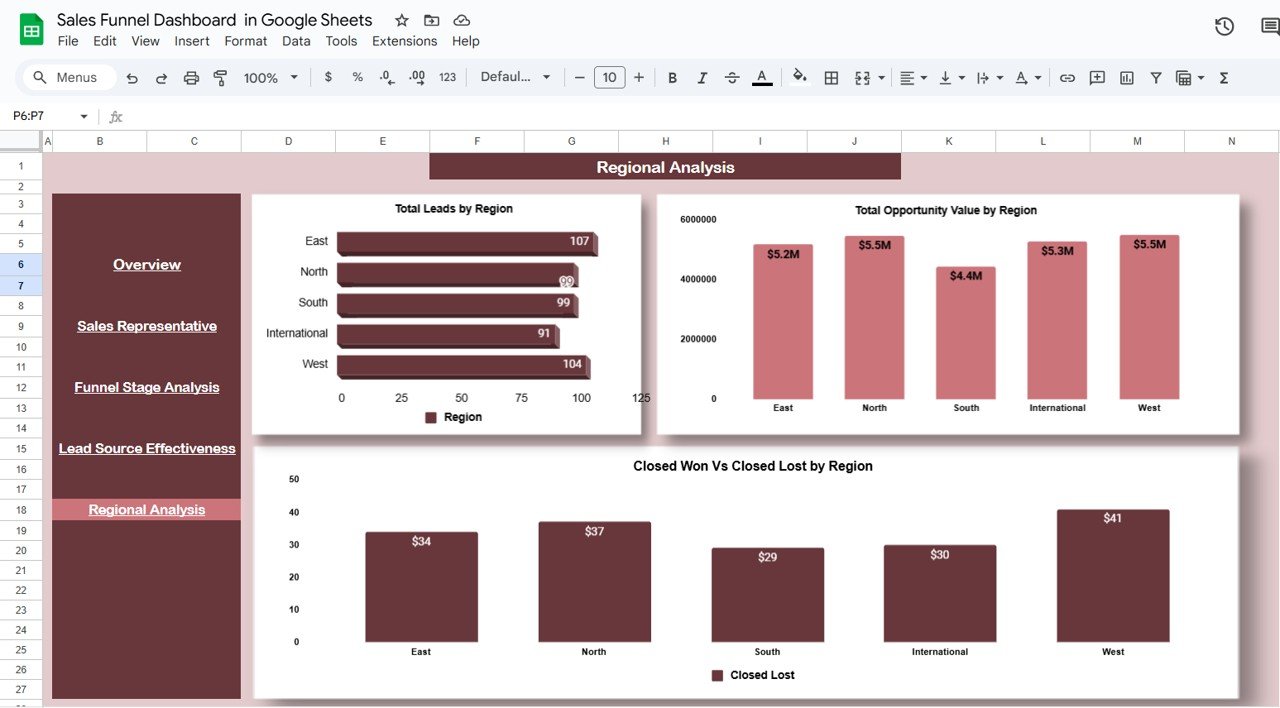
5. Regional Analysis Sheet Tab
Evaluate sales performance across geographic regions.
Charts:
-
Total Leads by Region
-
Total Opportunity Value by Region
-
Closed Won vs. Closed Lost by Region
Regional insights support targeted strategies and resource allocation.
Click to Buy Sales Funnel Dashboard in Google Sheets
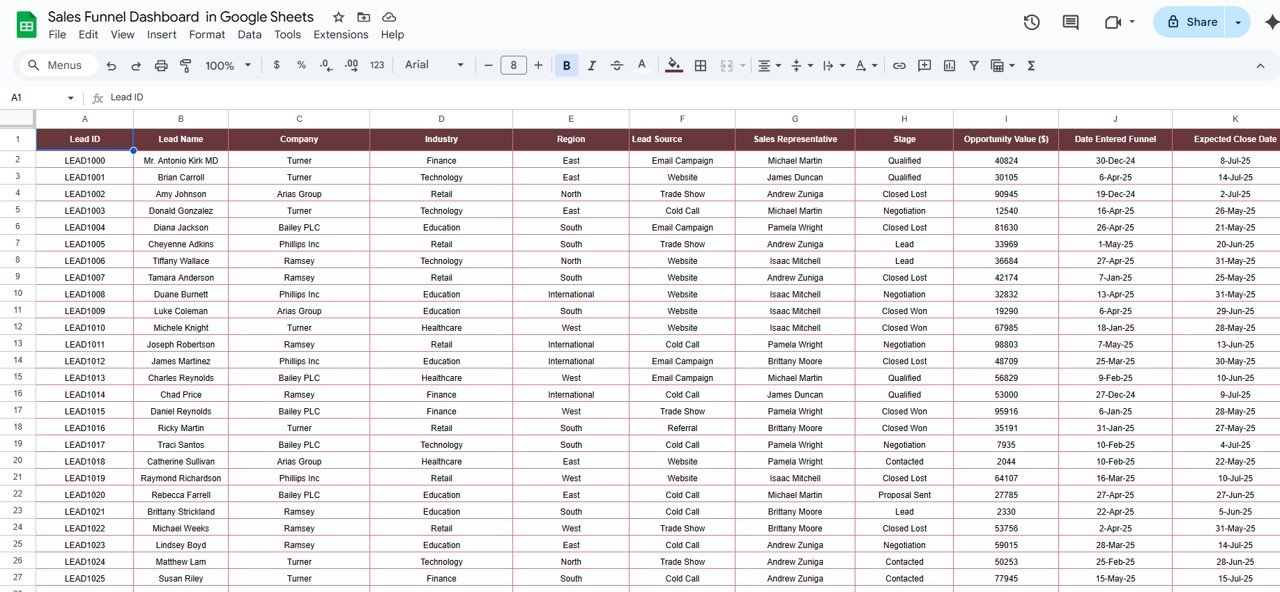
6. Data Sheet Tab
The Data Sheet is the input sheet for all sales-related metrics.
-
Capture information for leads, opportunities, stages, sources, regions, and sales representatives
-
Updates automatically reflect in all other dashboard sheets
-
Ensures accurate and consistent reporting across the dashboard
Advantages of Using the Sales Funnel Dashboard
-
Centralized Data: All pipeline information in one place
-
Real-Time Insights: Update data to instantly see changes in dashboards
-
Identify Bottlenecks: Spot stages or sources where leads are stalled
-
Sales Team Performance: Evaluate reps and assign coaching opportunities
-
Optimize Lead Sources: Focus on high-converting channels
-
Revenue Forecasting: Use opportunity values to predict potential revenue
Best Practices for Using the Dashboard
Click to Buy Sales Funnel Dashboard in Google Sheets
-
Update Data Regularly: Keep the Data Sheet up-to-date for accurate tracking
-
Monitor Conversion Rates: Track lead-to-deal ratios for each stage and rep
-
Segment Data: Filter by industry, region, lead source, or sales rep for deeper insights
-
Analyze Funnel Duration: Identify leads that spend excessive time in the funnel
-
Focus on High-Value Opportunities: Prioritize leads with the highest potential revenue
-
Share Insights with Team: Use charts to communicate performance and align goals
Frequently Asked Questions (FAQs)
Click to Buy Sales Funnel Dashboard in Google Sheets
Q1: Can I customize the dashboard to my business?
Yes, you can add or remove KPIs, stages, regions, or lead sources to fit your sales process.
Q2: How often should data be updated?
Update data daily or weekly depending on lead flow and reporting needs.
Q3: Can I track performance by sales representative and region simultaneously?
Yes, filters and charts allow multi-dimensional analysis for better insights.
Q4: Can this dashboard help with forecasting revenue?
Yes, opportunity values and stage analysis help predict potential revenue and pipeline health.
Q5: Is this dashboard suitable for small and large teams?
Absolutely. Google Sheets supports collaborative updates, making it scalable for any team size.
Conclusion
The Sales Funnel Dashboard in Google Sheets provides a comprehensive, visual solution for monitoring leads, opportunities, and sales performance. By using this dashboard, sales teams and managers can identify bottlenecks, optimize performance, and make data-driven decisions to increase revenue.
Visit our YouTube channel to learn step-by-step video tutorials
Youtube.com/@NeotechNavigators
Watch the step-by-step video Demo: