In today’s competitive academic world, scholarship programs play a crucial role in promoting equal opportunities and rewarding excellence. However, managing, tracking, and evaluating scholarship data across multiple students, institutions, and time periods can become challenging without an efficient monitoring tool.
That’s where the Scholarship Program KPI Dashboard in Google Sheets comes into the picture — a ready-to-use, interactive, and data-driven solution that simplifies performance tracking and reporting for educational administrators, NGOs, and funding organizations.
This comprehensive guide explains everything you need to know about the Scholarship Program KPI Dashboard — from its structure and key features to its benefits, best practices, and frequently asked questions.
Click to buy Scholarship Program KPI Dashboard in Google Sheets
What Is a Scholarship Program KPI Dashboard in Google Sheets?
A Scholarship Program KPI Dashboard is a visual analytics tool built in Google Sheets that helps administrators and donors monitor key performance indicators (KPIs) related to scholarship programs.
It consolidates data from multiple sources — such as student applications, award disbursements, fund utilization, academic results, and follow-up reports — into one centralized and interactive platform.
Instead of manually updating multiple spreadsheets or compiling reports each month, this dashboard automatically calculates metrics like:
- Total Applications Received
- Scholarships Awarded
- Application-to-Approval Ratio
- Fund Utilization Rate
- Academic Performance of Scholars
- Renewal Rate of Scholarships
- Dropout Ratio
This streamlined visibility allows decision-makers to identify trends, measure impact, and make data-driven adjustments in real time.
Why Use Google Sheets for Scholarship KPI Dashboards?
Google Sheets is not just a spreadsheet tool — it’s a powerful platform for real-time data collaboration and visualization. Here’s why it’s ideal for scholarship tracking:
- Cloud-based accessibility: Teams can work together from anywhere with shared access.
- Automation and formulas: Built-in functions make KPI calculations simple and efficient.
- Dynamic charts: Instantly visualize progress and performance.
- Data validation and drop-downs: Maintain data accuracy and prevent entry errors.
- Integration: Connects with Google Forms, Google Data Studio, and other tools for deeper insights.
In short, it offers the perfect balance of flexibility, simplicity, and analytical power — ideal for non-profits, universities, and government education boards.
Structure of the Scholarship Program KPI Dashboard
The Scholarship Program KPI Dashboard in Google Sheets is designed with a structured and user-friendly layout. It includes 7 key worksheets, each with a unique function to make data entry, analysis, and visualization seamless.
Let’s explore each tab in detail:
Dashboard Sheet Tab
This is the main visualization page of the dashboard. It brings together all KPI data in a clean, professional layout.
- The month can be selected using the drop-down in cell D3, and all metrics automatically update.
- The dashboard displays:
- MTD (Month-to-Date) and YTD (Year-to-Date) performance
- Actual vs Target comparisons
- Previous Year vs Current Year analysis
- Conditional formatting arrows (green for improvement, red for decline)
This sheet is ideal for monthly reporting, donor reviews, and management presentations.

Click to buy Scholarship Program KPI Dashboard in Google Sheets
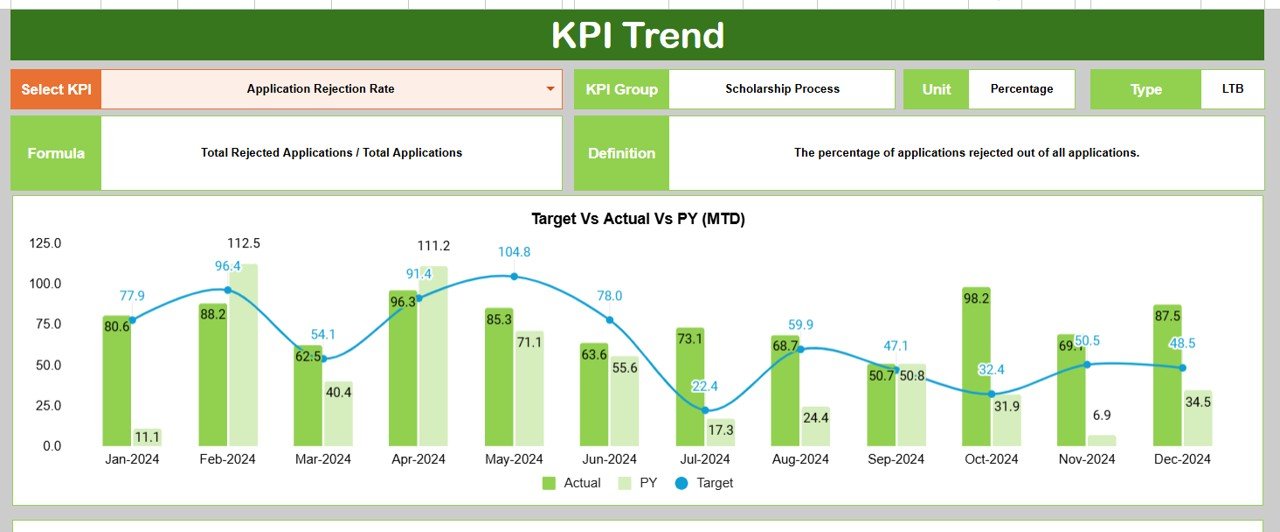
Trend Sheet Tab
This sheet allows users to drill down into each KPI for a detailed analysis.
- Select any KPI from the drop-down list in cell C3.
- Automatically view details such as:
- KPI Group
- Unit of measurement
- KPI Type — LTB (Lower the Better) or UTB (Upper the Better)
- Formula and Definition
- The sheet also shows MTD and YTD trend charts for Actual, Target, and Previous Year values — helping users visualize progress and identify gaps.
Click to buy Scholarship Program KPI Dashboard in Google Sheets
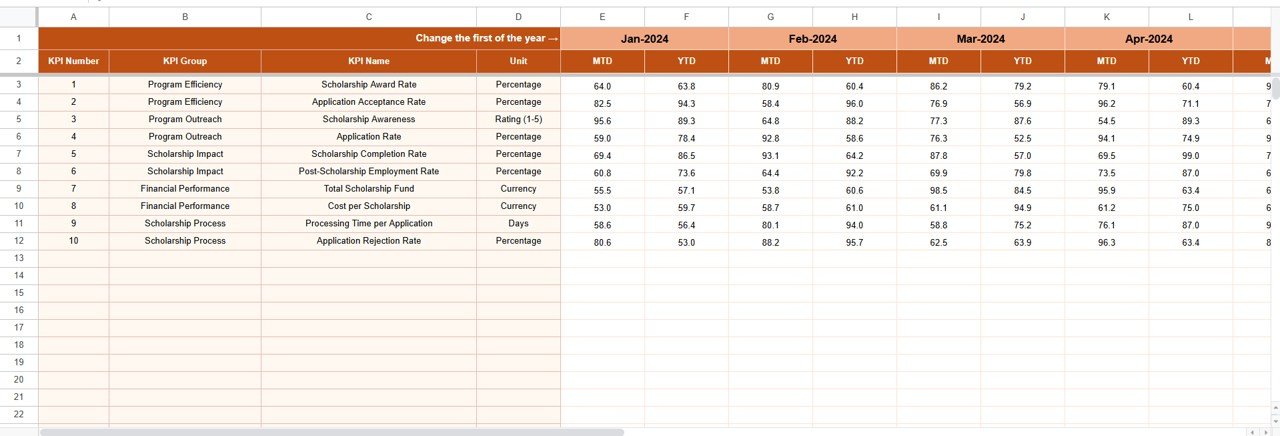
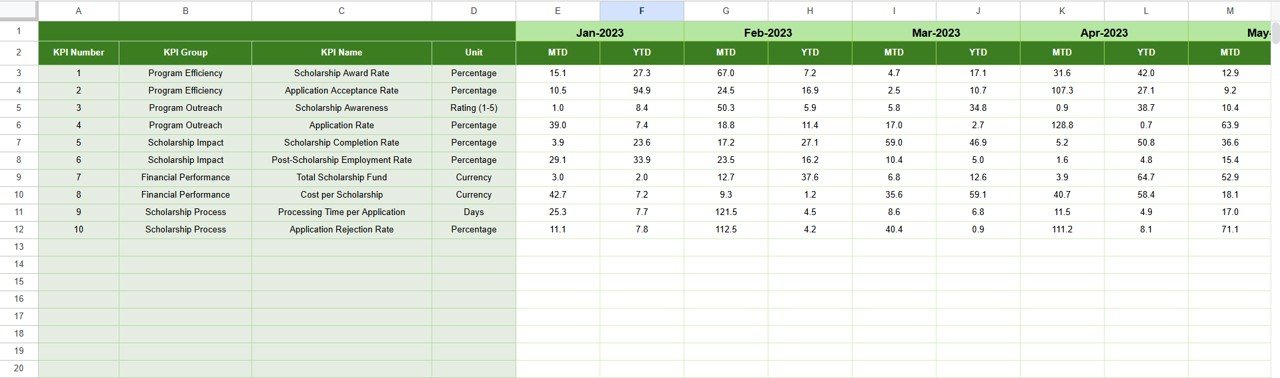
Actual Numbers Input Sheet
This sheet is where you enter the actual performance numbers for each month.
- The base month is defined in cell E1, and the sheet automatically adjusts subsequent periods.
- Enter MTD and YTD values for each KPI.
- Once updated, all linked dashboards and trend charts refresh instantly.
This ensures consistency and real-time accuracy.
Click to buy Scholarship Program KPI Dashboard in Google Sheets
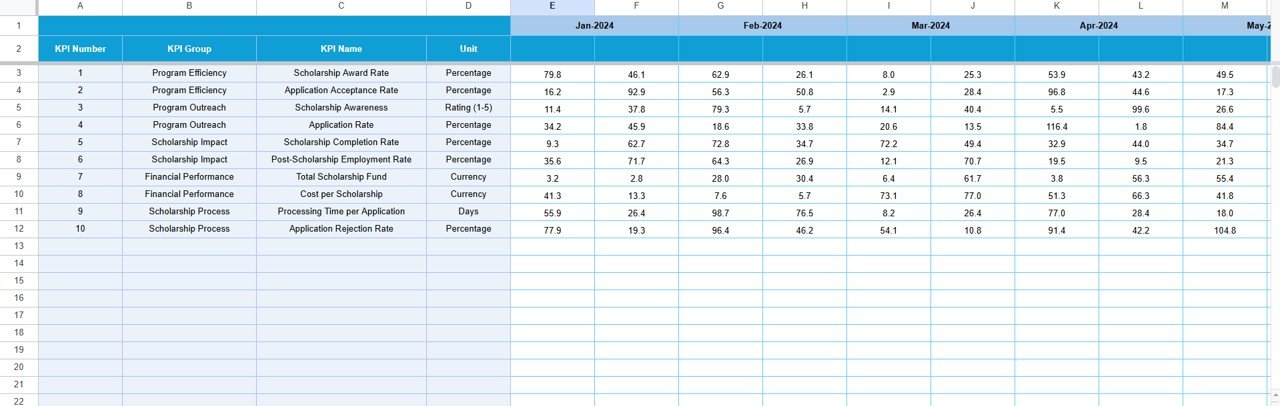
Target Sheet Tab
Every performance system needs benchmarks. This sheet stores the monthly and yearly target values for all KPIs.
- Enter MTD and YTD targets for each metric.
- Compare actual results against goals to measure effectiveness.
- Use color-coded cells for easy identification of achieved vs missed targets.
This helps program managers set realistic goals and monitor progress efficiently.
Click to buy Scholarship Program KPI Dashboard in Google Sheets
Previous Year Numbers Sheet Tab
To analyze growth or decline, this sheet contains data from the previous year.
- Enter MTD and YTD values similar to the current year format.
- Automatically calculates YoY (Year-over-Year) changes.
- Helps visualize long-term improvement or stagnation.
This is crucial for donors and management to assess impact sustainability.
Click to buy Scholarship Program KPI Dashboard in Google Sheets
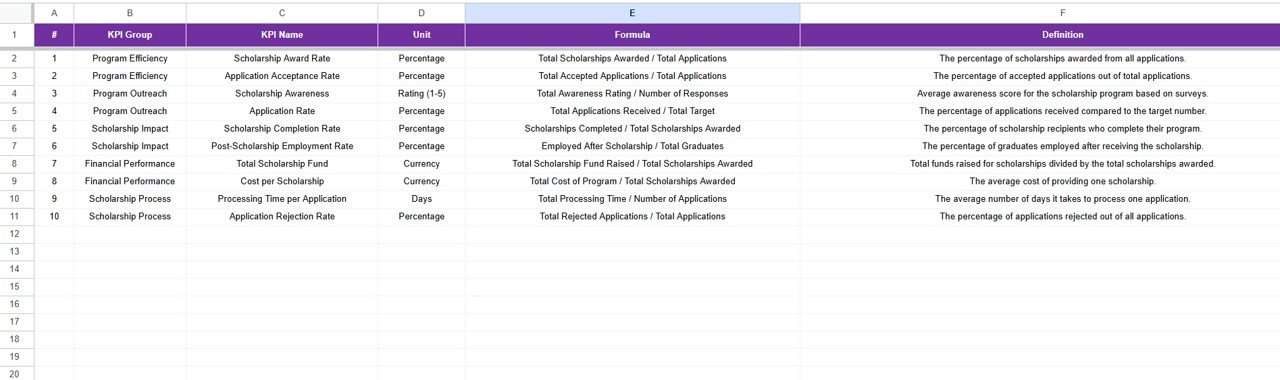
KPI Definition Sheet Tab
Transparency is essential in scholarship management. This tab defines every KPI clearly.
- Include columns for KPI Name, KPI Group, Unit, Formula, and Definition.
- Helps users understand what each metric means and how it’s calculated.
- Ensures standardization across reporting teams.
This sheet also serves as documentation for new users or auditors.
Click to buy Scholarship Program KPI Dashboard in Google Sheets
Data Validation and Setup Sheet (Optional)
Many dashboards include an extra setup sheet to store drop-down values such as:
- List of Months
- KPI Groups
- Units
- Type (LTB/UTB)
This makes the dashboard more flexible and reduces data errors during updates.
How the Scholarship KPI Dashboard Works
The workflow of this dashboard is simple yet powerful:
- Define KPIs: List all scholarship-related performance metrics in the KPI Definition sheet.
- Set Targets: Add monthly and annual goals in the Target Sheet tab.
- Input Actual Data: Enter results in the Actual Numbers Input sheet.
- Compare Results: The Dashboard and Trend tabs visualize differences using charts, arrows, and colors.
- Review Insights: Analyze which areas performed well and which need attention.
This automated process eliminates manual reporting and improves decision-making accuracy.
Advantages of Scholarship Program KPI Dashboard in Google Sheets
Implementing this dashboard brings numerous benefits to educational institutions and funding organizations:
- Centralized Data Management
All program data resides in one file — no more scattered spreadsheets or version confusion.
- Real-Time Insights
Instantly view the latest performance metrics without waiting for manual reports.
- Improved Transparency
Clearly defined KPIs and automated tracking promote accountability.
- Enhanced Decision-Making
Data-driven visuals empower managers to identify bottlenecks and take timely actions.
- Easy Collaboration
Because it’s built in Google Sheets, multiple users can view or edit the dashboard simultaneously.
- Customizable Design
You can modify the layout, KPIs, or visuals according to your program’s unique needs.
- Cost-Effective Solution
No need for expensive BI tools — Google Sheets offers powerful features for free.
Key Features at a Glance
Here’s a quick summary of what the Scholarship Program KPI Dashboard offers:
- Interactive month selector
- KPI cards showing MTD and YTD summaries
- Conditional formatting arrows for performance comparison
- Trend charts for Actual, Target, and Previous Year
- Auto-updating linked data across sheets
- Clearly defined KPI documentation
- Real-time collaboration and sharing
Together, these features create a smooth and efficient performance-tracking system.
How to Use the Dashboard Effectively
To maximize the impact of your Scholarship Program KPI Dashboard, follow these steps:
- List all KPIs relevant to your scholarship goals.
- Set realistic targets for each metric based on historical data.
- Update actual data monthly without missing any KPI.
- Review trends using charts and identify areas needing improvement.
- Share the dashboard with stakeholders to maintain transparency.
- Regularly revise KPIs to match evolving program objectives.
These actions ensure that your dashboard stays dynamic and insightful over time.
Best Practices for the Scholarship Program KPI Dashboard
To make the most of this dashboard, adopt the following best practices:
1. Use Consistent Data Entry
Always use the same formats for dates, percentages, and values to maintain accuracy.
2. Keep the KPI Definitions Updated
As the scholarship evolves, update formulas, definitions, and targets to reflect new priorities.
3. Automate Where Possible
Use Google Sheets formulas like SUMIFS, AVERAGEIFS, and ARRAYFORMULA to automate calculations.
4. Apply Visual Cues
Conditional formatting helps users instantly understand performance — green for success, red for gaps.
5. Protect Critical Cells
Lock formulas and layout cells to avoid accidental edits.
6. Integrate with Google Forms
Collect application data directly from Google Forms into the dashboard for real-time updates.
7. Review Monthly and Annually
Hold regular review meetings to discuss dashboard results and improvement strategies.
These best practices keep your dashboard accurate, engaging, and easy to maintain.
Conclusion
The Scholarship Program KPI Dashboard in Google Sheets is more than just a spreadsheet — it’s a comprehensive monitoring system that empowers institutions, donors, and administrators to measure and improve their scholarship impact.
It transforms complex data into clear insights, enabling faster decisions and better outcomes for students worldwide.
Whether you manage a small community scholarship or a large university fund, this tool will save time, enhance accountability, and boost program performance — all from the comfort of Google Sheets.
Frequently Asked Questions (FAQs)
- What is the purpose of a Scholarship Program KPI Dashboard?
It helps track, analyze, and improve scholarship performance metrics such as fund utilization, application rate, and student success in one central platform.
- Can I customize this dashboard for my institution’s needs?
Yes. You can easily modify KPIs, chart types, or colors in Google Sheets to suit your unique reporting requirements.
- Do I need technical skills to use this dashboard?
Not at all. The dashboard uses simple formulas, drop-downs, and visual charts — perfect for beginners.
- How often should I update the data?
It’s best to update data monthly to maintain accurate MTD and YTD comparisons.
- Can multiple users work on the dashboard at once?
Yes. Google Sheets supports real-time collaboration, so multiple users can edit or review data simultaneously.
- Is this dashboard compatible with Google Data Studio or Excel?
Yes. You can connect it with Google Data Studio for advanced visualization or export data to Excel if required.
- What are the main KPIs I should include?
Common KPIs include Application Count, Approval Rate, Fund Utilization %, Renewal Rate, and Student GPA Improvement.
Visit our YouTube channel to learn step-by-step video tutorials
Watch the step-by-step video tutorial:
Click to buy Scholarship Program KPI Dashboard in Google Sheets