Managing a co-working space involves balancing occupancy, operations, finances, and customer satisfaction — all while ensuring efficient space utilization. The Co-working Space KPI Dashboard in Google Sheets is designed to simplify that process by bringing together all performance metrics into a single, visual, and data-driven platform.Co-working Space KPI Dashboard in Google Sheets
This ready-to-use dashboard helps co-working space owners, managers, and operators track, analyze, and improve business performance with real-time data visibility.Co-working Space KPI Dashboard in Google Sheets
Get the Co-working Space KPI Dashboard in Google Sheets
What Is a Co-working Space KPI Dashboard in Google Sheets?
The Co-working Space KPI Dashboard is an interactive reporting tool built in Google Sheets that tracks all key performance indicators related to occupancy, revenue, space utilization, and customer satisfaction.Co-working Space KPI Dashboard in Google Sheets
It helps users view Month-To-Date (MTD) and Year-To-Date (YTD) metrics, compare Actual vs Target, and analyze trends over time. With conditional formatting, traffic lights, and arrows, the dashboard instantly highlights areas that are improving or need attention.
Dashboard Structure Overview
The dashboard includes 6 worksheets, each designed for a specific analytical purpose.Co-working Space KPI Dashboard in Google Sheets
dashboard Sheet Tab
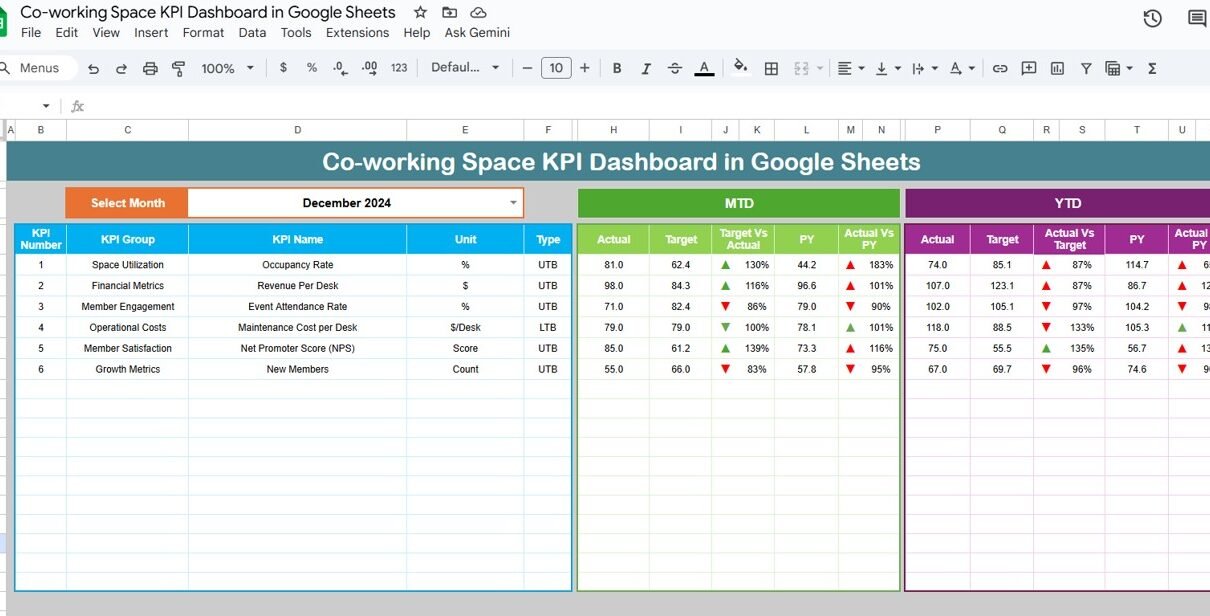
This is the main visualization sheet, where you can view all KPIs in one place.Co-working Space KPI Dashboard in Google Sheets
-
Month Selector (Range D3): Choose any month from the dropdown. All KPI values update automatically.
-
KPIs Displayed:
- MTD (Month-to-Date) Actual vs Target vs Previous Year
- YTD (Year-to-Date) Actual vs Target vs Previous Year
Conditional Formatting:
- 🟢 Green arrow = Performance improved
- 🔴 Red arrow = Performance declined
This tab provides an instant view of business performance and trends.

2️⃣ KPI Trend Sheet Tab
Here, you can select a KPI from the dropdown (Cell C3) and view:
-
KPI Group
-
Unit of Measurement
-
Type (UTB – Upper the Better, LTB – Lower the Better)
-
Formula
-
Definition
-
Historical performance trend
This sheet is ideal for monthly tracking and identifying long-term progress patterns.

3️⃣ Actual Number Sheet Tab
This sheet is where you input Actual KPI data for each month.
-
Range E1: Select the first month of the year (e.g., January).
-
Enter MTD and YTD values for every KPI.
-
The dashboard auto-calculates comparisons and percentages.

4️⃣ Target Sheet Tab
In this sheet, you enter Target values for each KPI on a monthly and YTD basis.
Targets define your performance goals, enabling the dashboard to measure variance effectively.

5️⃣ Previous Year Number Sheet Tab
Enter the previous year’s KPI data to track YoY (Year-over-Year) progress.
This historical data helps analyze long-term improvements or setbacks.

6️⃣ KPI Definition Sheet Tab
This sheet defines every KPI in detail — including Group, Unit, Formula, Definition, and Type (LTB or UTB).

Advantages of the Co-working Space KPI Dashboard
-
Comprehensive View: Monitors occupancy, financials, and customer satisfaction in one place.
-
Data-Driven Decisions: Compare Actual vs Target and track YoY trends instantly.
-
Visual Performance Indicators: Traffic lights and arrows simplify data interpretation.
-
Collaboration-Friendly: Google Sheets enables multiple users to update data simultaneously.
-
Scalable Design: Add new KPIs or departments as your space expands.
-
Real-Time Updates: Automatically refreshes metrics as soon as data is entered.
-
Strategic Insights: Identify underperforming areas for focused improvement.
Opportunities for Improvement
You can enhance this dashboard with automation and deeper analytics:
-
Integrate Google Forms: Capture occupancy, maintenance, and feedback data automatically.
-
Add Predictive Analytics: Forecast occupancy and revenue using Google Sheets formulas.
-
Automated Alerts: Notify management when KPIs fall below thresholds.
-
Cost vs Revenue Visualization: Add charts comparing operational cost vs income.
-
Link to CRM: Import lead and membership data automatically.
Best Practices for Using the Dashboard
-
Update Data Monthly: Keep Actual and Target sheets current for accurate tracking.
-
Define KPIs Clearly: Ensure all team members understand KPI meanings and calculations.
-
Validate Data: Double-check monthly data entries before analysis.
-
Standardize Units: Keep consistent measurement units for clarity.
-
Train Users: Provide short training to ensure proper usage.
-
Use Conditional Formatting: Highlight key metrics automatically.
Conclusion
The Co-working Space KPI Dashboard in Google Sheets is a powerful and intuitive solution for space operators who want to monitor performance effectively. It combines occupancy analytics, financial monitoring, operational efficiency, and customer feedback — all in one centralized dashboard.
With real-time updates, visual indicators, and actionable insights, this tool empowers teams to make data-driven decisions that enhance profitability, utilization, and customer satisfaction.
Interested in building dashboards like this yourself? The Excel Pivot Tables & Dashboards course on NextGenTemplates Academy teaches the method with practice files.
Get the Co-working Space KPI Dashboard in Google Sheets
Frequently Asked Questions (FAQ)
1. Can I track multiple locations in the same dashboard?
Yes, you can add a “Location” column in the data sheets and use filters for multi-site reporting.
2. Can I modify or add KPIs?
Absolutely. The dashboard is fully customizable — simply update the KPI Definition Sheet and relevant formulas.
3. Does it include trend analysis?
Yes, the KPI Trend Sheet displays month-wise performance and trends for any KPI.
4. Can I automate data entry?
Yes, using Google Forms or integrations like Zapier and Google Apps Script.
5. Can this be shared across departments?
Yes, Google Sheets supports real-time collaboration and permission-based sharing.