A Scrum team needs clarity, speed, and continuous improvement. Because Agile cycles move fast, leaders need real-time visibility into how their Scrum teams perform. Yet many teams struggle to track work velocity, sprint progress, backlog health, team capacity, and quality issues. That is why a Scrum Team KPI Dashboard in Google Sheets becomes a powerful and simple solution.Scrum Team KPI Dashboard in Google Sheets
This dashboard works as an all-in-one performance tracker. It gives a quick and clear view of sprint efficiency, delivery trends, and team productivity. Moreover, it updates instantly when you change the month, targets, or numbers. It helps Scrum Masters, Product Owners, and management review progress with accurate metrics.Scrum Team KPI Dashboard in Google Sheets
In this article, you will learn how the dashboard works, what KPIs it includes, how each sheet functions, and how Scrum teams can use it to deliver better outcomes in every sprint.Scrum Team KPI Dashboard in Google Sheets
What Is a Scrum Team KPI Dashboard in Google Sheets?
A Scrum Team KPI Dashboard is a smart reporting tool that monitors and analyzes all key performance indicators related to Agile delivery. It converts raw sprint data into simple and meaningful visuals. Because it runs inside Google Sheets, it works anywhere, loads fast, and updates in real-time.
The dashboard shows metrics for:
- Sprint delivery
- Sprint planning
- Work quality
- Team capacity
- Backlog management
- Customer satisfaction
- Improvement cycles
The dashboard helps teams stay aligned with Agile principles while improving transparency across the organization.
Key Worksheet Structure in the Dashboard
Click to Buy Scrum Team KPI Dashboard in Google Sheets
This dashboard includes 6 worksheet tabs. Each tab plays a big role in tracking and improving team performance.
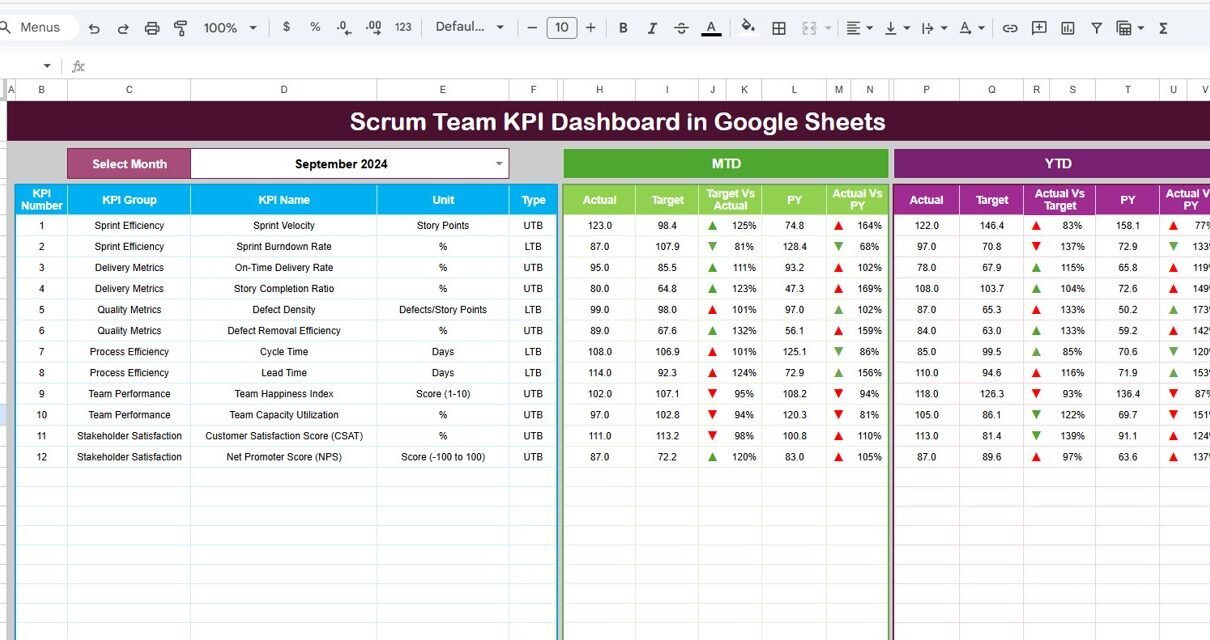
Dashboard Sheet Tab (Main Page)
This is the most important sheet. On cell D3, you select the month from a dropdown. The moment you change the month, the whole dashboard updates instantly.
The dashboard shows:
MTD (Month-to-Date)
- MTD Actual
- MTD Target
- MTD Previous Year
- MTD Target vs Actual
- MTD Previous Year vs Actual
YTD (Year-to-Date)
- YTD Actual
- YTD Target
- YTD Previous Year
- YTD Target vs Actual
- YTD Previous Year vs Actual
To make insights clearer, the dashboard uses conditional formatting arrows:
- Green arrow = better performance
- Red arrow = decline
- Yellow arrow = neutral
This gives managers a fast view of performance without reading long reports.

Click to Buy Scrum Team KPI Dashboard in Google Sheets
KPI Trend Sheet Tab
This sheet shows a month-wise comparison for one selected KPI.
You choose the KPI name from a dropdown in cell C3.
The sheet displays:
- KPI Group
- KPI Unit
- KPI Type (UTB or LTB)
- KPI Formula
- KPI Definition
It also shows line charts for all 12 months to help identify trends, patterns, and spikes.

Click to Buy Scrum Team KPI Dashboard in Google Sheets
Actual Number Sheet Tab
This sheet holds MTD and YTD actual values for every KPI.
You select the first month of the year in cell E1. The spreadsheet auto-adjusts the monthly structure.
You update your sprint or monthly data here, and the dashboard updates automatically.

Target Sheet Tab
This sheet stores MTD and YTD targets for every KPI.
You can enter:
- Team velocity targets
- Sprint goal completion targets
- Bug count reduction targets
- Backlog metrics
Targets help you compare planned and actual results.

Click to Buy Scrum Team KPI Dashboard in Google Sheets
Previous Year Sheet Tab
This tab stores previous year data to help compare:
- Sprint progress
- Story points delivered
- Quality improvements
- Backlog refinement
- Bug trends
This gives strong visibility into long-term improvement.

KPI Definition Sheet Tab
This is the reference sheet that stores:
- KPI Name
- KPI Group
- Unit
- Formula
- Definition
- KPI Type (LTB/UTB)
It keeps all Scrum KPIs consistent and clear.

Click to Buy Scrum Team KPI Dashboard in Google Sheets
Why Do Scrum Teams Need This Dashboard?
A Scrum team works in fast cycles. Because work moves quickly, teams need a simple and reliable tool to track performance. This dashboard helps teams:
- Deliver predictable sprints
- Improve planning accuracy
- Reduce bottlenecks
- Improve quality
- Increase team morale
- Maintain healthy backlog
- Strengthen collaboration
The dashboard becomes a daily tool for Scrum Masters and Product Owners.
Advantages of the Scrum Team KPI Dashboard
Click to Buy Scrum Team KPI Dashboard in Google Sheets
- Improves Sprint Predictability: Teams understand their delivery capacity and commit smarter.
- Boosts Transparency: Management gets a single source of truth.
- Tracks Bottlenecks Early: KPIs like cycle time and WIP highlight delays.
- Enhances Team Performance: Teams adjust quickly based on month-to-month trends.
- Enables Data-Driven Decisions: The dashboard removes guesswork.
- Easy to Use and Easy to Update: No complex software or coding required.
Opportunities for Improvement in Scrum Team KPI Tracking
- Add sprint-level automation: Use Apps Script to automate updates.
- Integrate with Jira or Trello: Pull sprint data automatically.
- Add burndown and burn-up charts: These help track sprint flow.
- Track capacity by team member: Understand workload balance.
- Add quality KPIs like technical debt: Include dimensions for long-term improvement.
Best Practices for Using the Dashboard
Click to Buy Scrum Team KPI Dashboard in Google Sheets
- Update KPIs daily or weekly: Never wait for the end of the sprint.
- Use simple and consistent story point estimation: Avoid confusion during planning.
- Improve backlog grooming: Keep high-quality user stories ready.
- Encourage team collaboration: Use the dashboard as a shared learning tool.
- Conduct performance review every sprint: Use insights to refine your Scrum process.
Conclusion
A Scrum Team KPI Dashboard in Google Sheets helps Agile teams improve delivery speed, predictability, and quality. It gives clear insights into sprint performance, backlog readiness, team capacity, and customer satisfaction. Because the dashboard is simple, flexible, and fully automated, it becomes a powerful tool for any Scrum Master or Product Owner. With structured KPIs and clear data entry sheets, teams can make smarter decisions and deliver successful sprints consistently.
Frequently Asked Questions (FAQs)
Click to Buy Scrum Team KPI Dashboard in Google Sheets
1. What is the main goal of a Scrum KPI Dashboard?
It helps teams track performance, quality, and sprint outcomes.
2. Can Scrum KPIs change over time?
Yes, teams can add or remove KPIs as they mature.
3. Is this dashboard suitable for all Agile teams?
Yes, Kanban and hybrid teams can also use it.
4. Does it replace Jira reports?
No, it complements Jira by summarizing key KPIs.
5. Do I need technical skills to manage this dashboard?
No, basic Google Sheets skills are enough.
6. Can I use it for multiple teams?
Yes, with separate data-entry sheets.
Visit our YouTube channel to learn step-by-step video tutorials
Youtube.com/@NeotechNavigators
Watch the step-by-step video tutorial: