In an era where cities are becoming increasingly connected and intelligent, managing and optimizing the performance of a smart city requires tracking a wide range of key performance indicators (KPIs). The Smart Cities KPI Dashboard in Google Sheets is a ready-to-use template designed to help city managers, planners, and decision-makers track and monitor key metrics related to the city’s infrastructure, sustainability, economy, and social development.
In this article, we will explore the key features of the Smart Cities KPI Dashboard, the KPIs it tracks, and how it can help optimize the management and development of smart cities.
What is the Smart Cities KPI Dashboard in Google Sheets?
The Smart Cities KPI Dashboard in Google Sheets is a powerful tool for tracking the performance of key metrics that contribute to the development of smart cities. From energy consumption to waste management, transportation efficiency to social well-being, this dashboard helps you monitor critical data in real-time.
This Google Sheets template provides an easy-to-use interface where you can track your city’s performance across multiple areas, ensuring you meet your goals for sustainability, quality of life, and economic development. The dashboard offers a visual representation of KPIs, enabling better decision-making and resource allocation.
Key Features of the Smat Cities KPI Dashboard in Google Sheets
The Smart Cities KPI Dashboard consists of six worksheets, each designed to track specific aspects of a smart city’s performance:
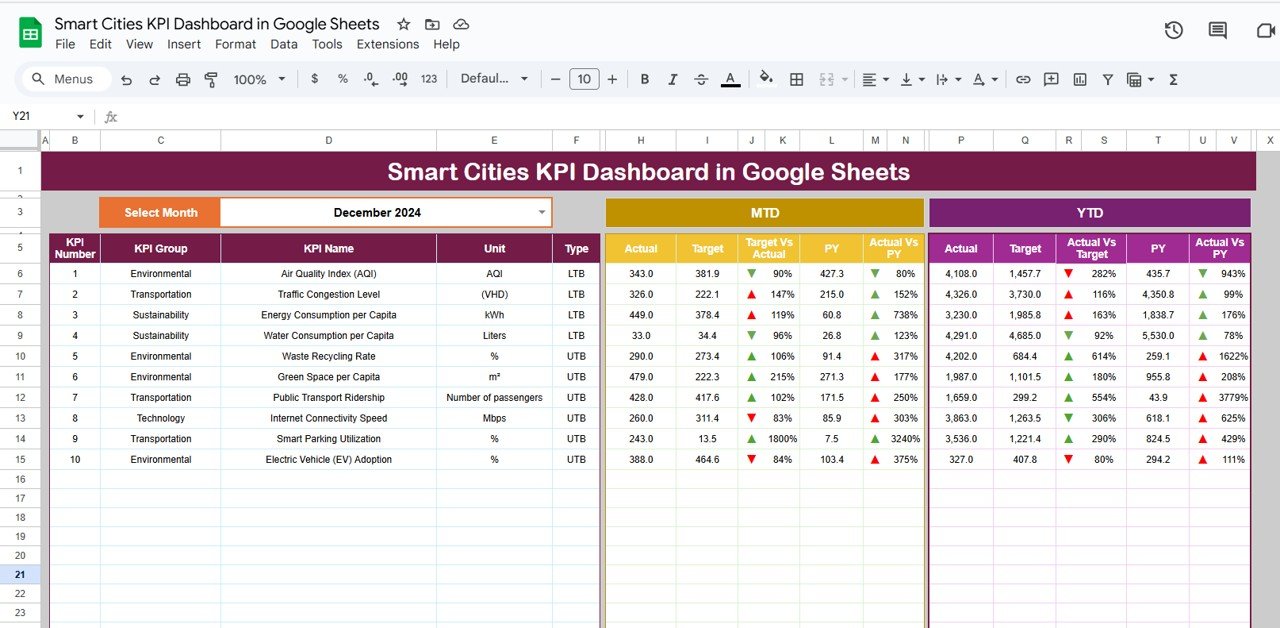
1. Dashboard Sheet Tab
The Dashboard Sheet is the main overview tab where all key performance metrics are displayed:
Month Dropdown (D3): Select the desired month, and the entire dashboard will update with data for that specific period.
Key Metrics:
- MTD Actual, Target, Previous Year Data: View actual performance for the current month, compare it with the target, and evaluate it against the previous year’s data.
- YTD Actual, Target, Previous Year Data: Track year-to-date performance and compare it with the target and last year’s data.
-
Conditional Formatting: Up and down arrows indicate whether each KPI is meeting or missing the target for both MTD and YTD data.

Click to buy Smart Cities KPI Dashboard in Google Sheets
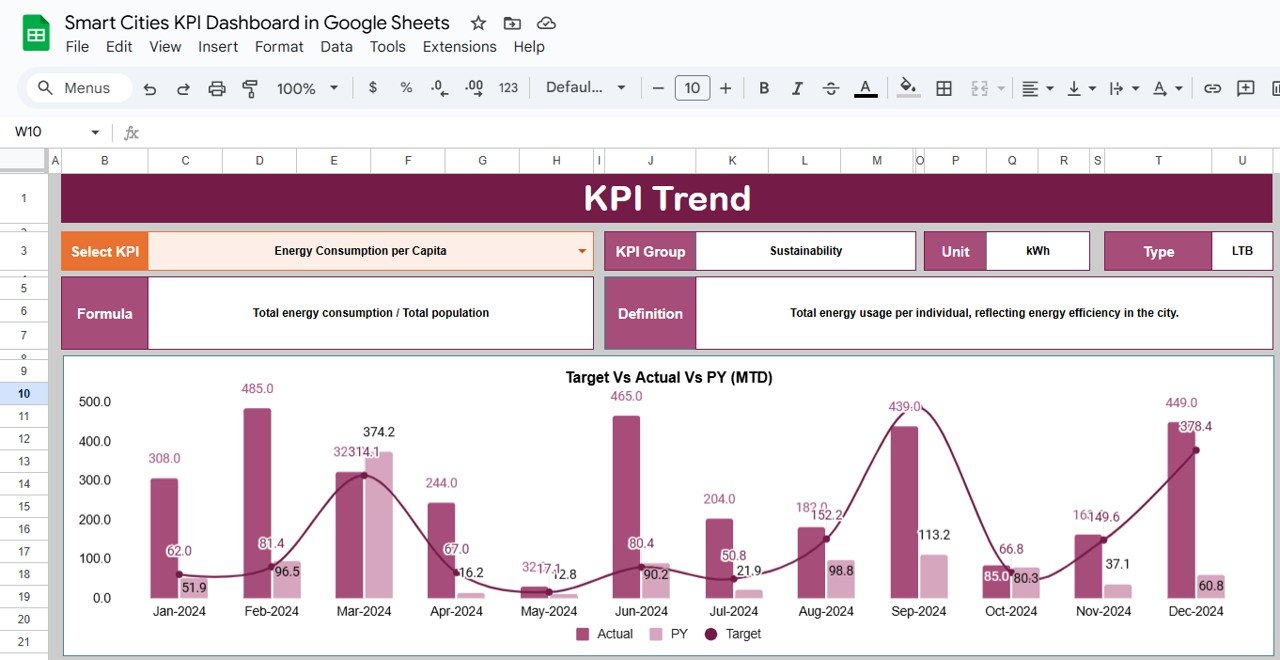
2. KPI Trend Sheet Tab
The KPI Trend Sheet allows you to analyze performance trends over time:
-
KPI Selection Dropdown (C3): Select a specific KPI from the dropdown, and the sheet will display its trend across the last several months.
-
KPI Group, Unit, Type: This section shows the KPI’s group (e.g., energy, traffic, social well-being), its unit of measurement (e.g., kilowatt-hours, kilometers per hour), and whether the KPI is “Lower the Better” (LTB) or “Upper the Better” (UTB).
-
Formula and Definition: Displays the formula for calculating the KPI and a detailed explanation of what each KPI measures.
Click to buy Smart Cities KPI Dashboard in Google Sheets
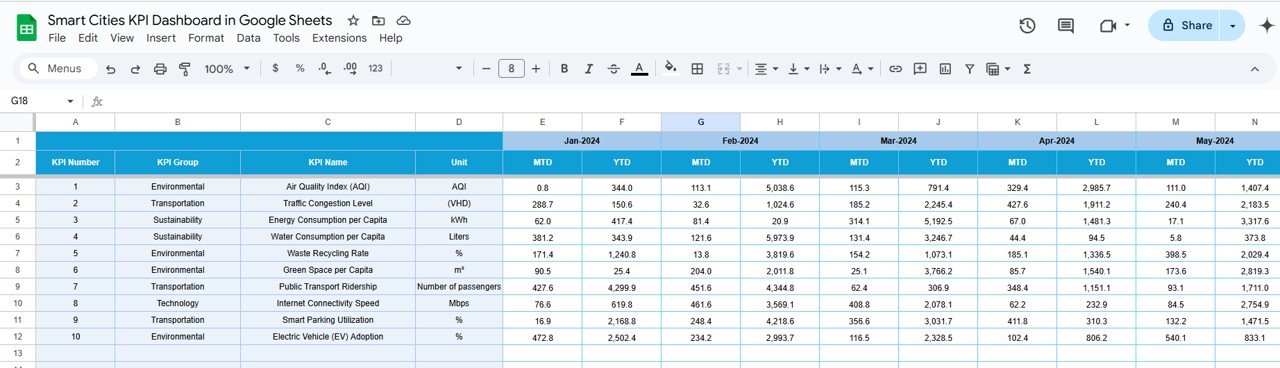
3. Actual Numbers Sheet Tab
This sheet allows you to input the actual performance data for each KPI:
-
MTD and YTD Data Input: Enter the actual performance values for each KPI, and the dashboard will update automatically.
-
Month Selection (E1): Select the first month of the year to refresh the data and ensure that the dashboard is updated accordingly.

Click to buy Smart Cities KPI Dashboard in Google Sheets
4. Target Sheet Tab
The Target Sheet is where you input the target values for each KPI:
-
Monthly and YTD Targets: Enter the target numbers for each KPI for both MTD and YTD, which will be used to compare actual performance.
Click to buy Smart Cities KPI Dashboard in Google Sheets
5. Previous Year Number Sheet Tab
This sheet stores data from the previous year, which is essential for comparison:
-
Historical Comparison: Enter data from the previous year to track performance trends and evaluate progress.

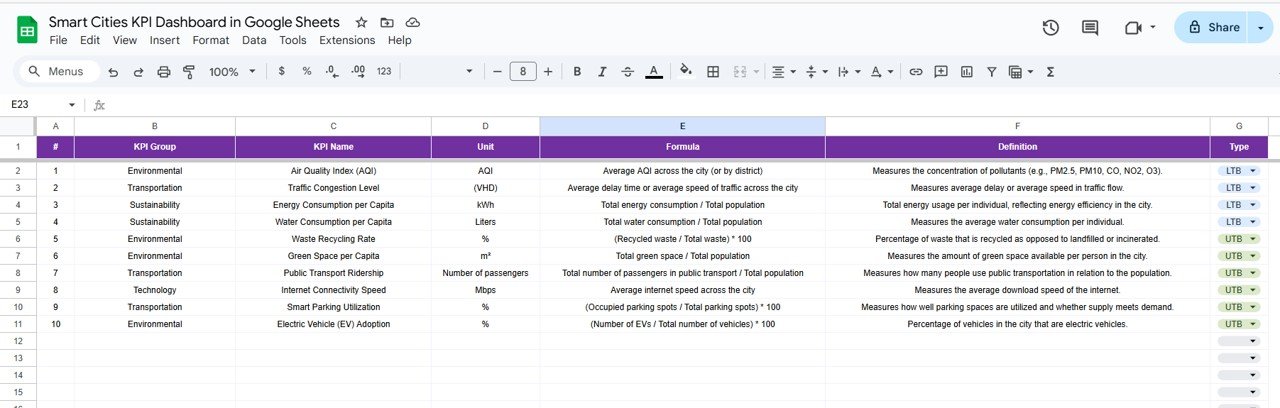
6. KPI Definition Sheet Tab
The KPI Definition Sheet provides detailed explanations of each KPI:
-
KPI Name, Group, Unit: Each KPI is named and categorized, and its unit of measurement is specified.
-
Formula and Definition: Each KPI’s formula and definition are provided to ensure clarity on how it is calculated and what it measures.
Advantages of Using the Smart Cities KPI Dashboard
The Smart Cities KPI Dashboard offers several key benefits for city managers and decision-makers:
-
Comprehensive Overview: Track all key performance metrics in one place, making it easier to monitor the progress of smart city initiatives.
-
Real-Time Data: Update the dashboard in real-time with actual data to make timely decisions and adjustments.
-
Improved Efficiency: Focus on the most impactful KPIs to optimize resource allocation and reduce inefficiencies in various city services.
-
Data-Driven Decision-Making: Use accurate data to make informed decisions that improve city performance and quality of life.
-
Customizable: The dashboard is fully customizable, allowing you to adapt it to your city’s unique needs and priorities.
Opportunity for Improvement in the Smart Cities KPI Dashboard
While the Smart Cities KPI Dashboard is a powerful tool, there are a few areas where it could be improved:
-
Automation: Automating data entry from city sensors or smart systems would reduce manual updates and increase accuracy.
-
Mobile-Friendly Version: Making the dashboard mobile-friendly would allow city managers to monitor KPIs on-the-go.
-
Predictive Analytics: Adding predictive analytics would help anticipate future trends and inform long-term planning.
-
Integration with City Data Systems: Integrating the dashboard with existing city management systems could provide real-time updates without manual data entry.
Best Practices for Using the Smart Cities KPI Dashboard
Click to buy Smart Cities KPI Dashboard in Google Sheets
To maximize the effectiveness of the Smart Cities KPI Dashboard, follow these best practices:
-
Update Data Regularly: Regularly update the dashboard with actual data to maintain an accurate reflection of the city’s performance.
-
Focus on High-Impact KPIs: Identify which KPIs have the most significant impact on your city’s development and prioritize them.
-
Collaborate Across Departments: Share the dashboard with various departments to ensure alignment and coordinated efforts across the city.
-
Analyze Trends: Look for trends over time and use them to adjust policies and strategies for improving city services.
-
Set Clear Targets: Establish achievable targets for each KPI to measure progress and guide improvement efforts.
Conclusion
The Smart Cities KPI Dashboard in Google Sheets is an essential tool for monitoring the performance of smart cities. By tracking key performance indicators such as energy efficiency, waste recycling, and traffic congestion, this dashboard provides valuable insights that can help improve city services, reduce costs, and enhance residents’ quality of life. The customizable and real-time nature of the dashboard ensures that city managers and decision-makers have the data they need to drive the city’s development in a sustainable and efficient manner.
Frequently Asked Questions (FAQs)
1. What KPIs are tracked in the Smart Cities KPI Dashboard?
The dashboard tracks KPIs related to energy, water usage, traffic, public health, crime rate, digital inclusion, and more.
2. How do I update the Smart Cities KPI Dashboard?
Simply enter the actual data in the Actual Numbers Sheet, and the dashboard will automatically update with real-time insights.
3. Can I customize the Smart Cities KPI Dashboard?
Yes, the dashboard is fully customizable. You can add or remove KPIs, adjust formulas, and modify the layout to suit your city’s needs.
4. How do I share the Smart Cities KPI Dashboard with others?
Since the dashboard is built in Google Sheets, you can easily share it with others by granting access via email or generating a shareable link.
5. Can the Smart Cities KPI Dashboard be automated?
Yes, you can integrate the dashboard with existing smart city systems for automated data entry and real-time updates.
Visit our YouTube channel to learn step-by-step video tutorials
Youtube.com/@NeotechNavigators
Watch the step-by-step video Demo: